Ingalls: Fire Incidents, Indiana (IN)
Where are fire incidents reported in Ingalls, IN
Something went wrong! Please refresh the page.
|
| |||||||||||||||||||||||||||||||||||||||||||||||||||||||||||||||||||||||||||||||||||||||||||||||||||||||||||||
2003 - 2015 National Fire Incident Reporting System (NFIRS) incidents
- Incident types reported to NFIRS in Ingalls, IN
- 10552.8%Fire
- 6130.7%Rescue & EMS
- 2613.1%Hazardous Condition
- 52.5%Good Intent Call
- 10.5%False Alarm
- 10.5%Severe Weather
- Fire incident types reported to NFIRS in Ingalls, IN
- 4341.0%Structure Fires
- 2927.6%Outside Fires
- 2725.7%Other
- 65.7%Mobile Property/Vehicle Fires
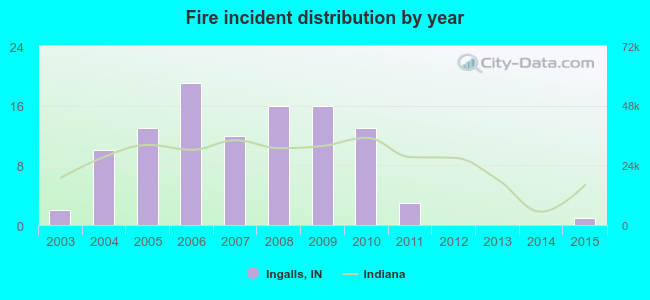 Based on the data from the years 2003 - 2015 the average number of fire incidents per year is 8. The highest number of fires - 19 took place in 2006, and the least - 0 in 2012. The data has a dropping trend.
 31.4% incidents where reported in the morning and 68.6% in the evening. The most fires (17.1%) took place on Monday, and the least (9.5%) on Saturday.
 Based on the 105 fires from years 2003 - 2015 most fires (13.3%) took place during June, and the least (3.8%) in December.
 Out of all 199 cases reported during the years 2003 - 2015, the most belonged to the categories: Fire (52.8%), Overpressure Rupture (30.7%), and Rescue & EMS (13.1%).
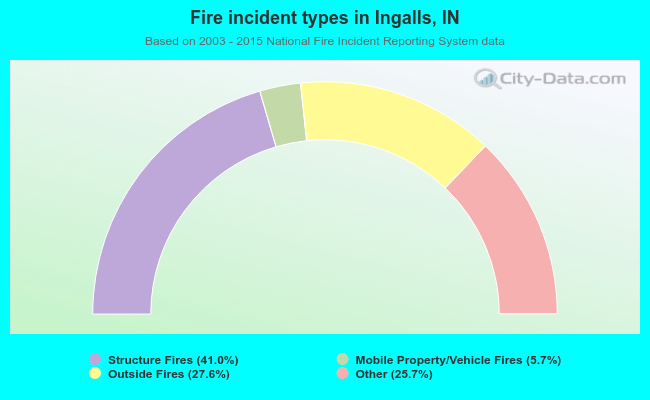 When looking into fire subcategories, the most reports belonged to: Structure Fires (41.0%), and Outside Fires (27.6%).