Iola: Fire Incidents, Kansas (KS)
Where are fire incidents reported in Iola, KS
Something went wrong! Please refresh the page.
| Fire incidents reported | |
|---|---|
| Sreet name | Count |
| STATE | 76 |
| 2000 ST | 38 |
| COTTONWOOD | 34 |
| 1000 ST | 30 |
| 1800 ST | 30 |
| 2200 ST | 30 |
| BUCKEYE | 28 |
| 1400 ST | 26 |
| KENTUCKY | 26 |
| WASHINGTON | 26 |
| WASHINGTON ST | 26 |
| 1200 ST | 24 |
| EISENHOWER | 24 |
| FOURTH | 24 |
| SYCAMORE | 24 |
| STATE ST | 22 |
| 400 ST | 20 |
| CHESTNUT | 20 |
| MINNESOTA | 20 |
| NEBRASKA | 20 |
| 169 HWY | 18 |
| KENTUCKY ST | 18 |
| MADISON | 18 |
| TEXAS RD | 18 |
| VERMONT | 18 |
| 600 ST | 16 |
| 800 ST | 16 |
| STREET | 16 |
| WEST VIRGINIA RD | 16 |
| 1600 ST | 14 |
| Other | 485 |
2002 - 2018 National Fire Incident Reporting System (NFIRS) incidents
- Incident types reported to NFIRS in Iola, KS
- 1,52443.6%Hazardous Condition
- 1,22134.9%Fire
- 2928.3%Rescue & EMS
- 2146.1%Good Intent Call
- 1404.0%False Alarm
- 742.1%Service Call
- 190.5%Overpressure Rupture
- 110.3%Severe Weather
- 40.1%Special Incident
- Fire incident types reported to NFIRS in Iola, KS
- 67455.2%Outside Fires
- 34328.1%Structure Fires
- 16613.6%Mobile Property/Vehicle Fires
- 383.1%Other
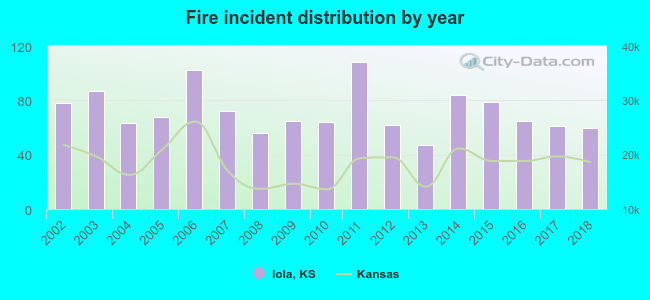 Based on the data from the years 2002 - 2018 the average number of fires per year is 72. The highest number of reported fires - 108 took place in 2011, and the least - 47 in 2013. The data has a dropping trend.
The average number of yearly fire incidents per 10k residents in Iola, KS compared to nearest cities:
(Note: Based on data for the last 3 years, including only cities with population 5,000 and above)
| Iola: | 111.7 |
| Chanute: | 98.3 |
| Fort Scott: | 218.9 |
| Parsons: | 91.1 |
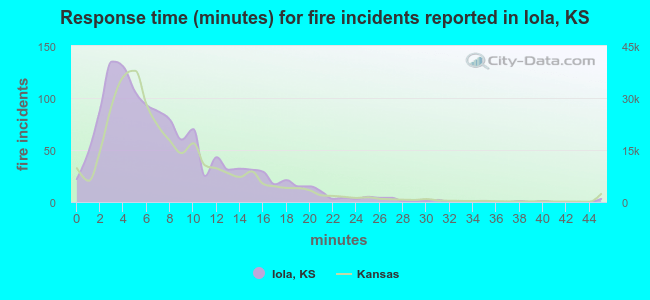 The median response time based on all reported fire incidents is 6 minutes. This is similar to the state median value.
The median response time in Iola, KS compared to nearest cities:
(Note: Based on data for all years, including only cities with at least 500 fire incidents)
| Iola: | 6 minutes |
| Chanute: | 6 minutes |
| Yates Center: | 10 minutes |
| Garnett: | 10 minutes |
| Burlington: | 10 minutes |
| Neodesha: | 5 minutes |
| Fort Scott: | 7 minutes |
| Parsons: | 6 minutes |
| Cherryvale: | 7 minutes |
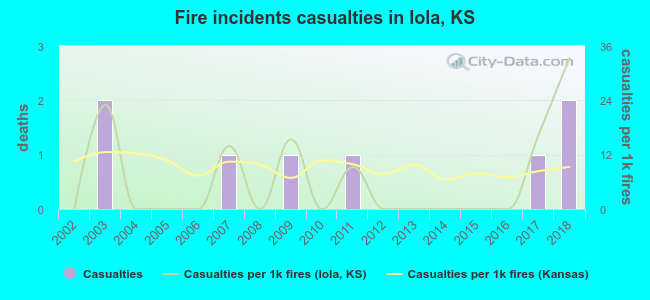 According to the reports from the years 2002 - 2018 the average number of fire-related casualties per year is 0. The highest number of injuries - 2 took place in 2003, and the lowest - 0 in 2002. The data has an increasing trend.
The average number of injuries per 1,000 fires is 7. This indicator was the highest - 33 in 2018, and the lowest 0 in 2002. The trend for injuries per 1,000 incidents is rising. Compared to the Kansas value the number of injuries per 1,000 fires is lower.
According to the reports from the years 2002 - 2018 the average number of fire-related casualties per year is 0. The highest number of injuries - 2 took place in 2003, and the lowest - 0 in 2002. The data has an increasing trend.
The average number of injuries per 1,000 fires is 7. This indicator was the highest - 33 in 2018, and the lowest 0 in 2002. The trend for injuries per 1,000 incidents is rising. Compared to the Kansas value the number of injuries per 1,000 fires is lower.Casualties per 1,000 incidents in Iola, KS compared to nearest cities:
(Note: Based on data for all years, including only cities with at least 500 fire incidents)
| Iola: | 6.6 |
| Chanute: | 11.8 |
| Yates Center: | 0.0 |
| Garnett: | 0.9 |
| Burlington: | 1.6 |
| Neodesha: | 12.3 |
| Fort Scott: | 3.7 |
| Parsons: | 9.1 |
| Cherryvale: | 3.5 |
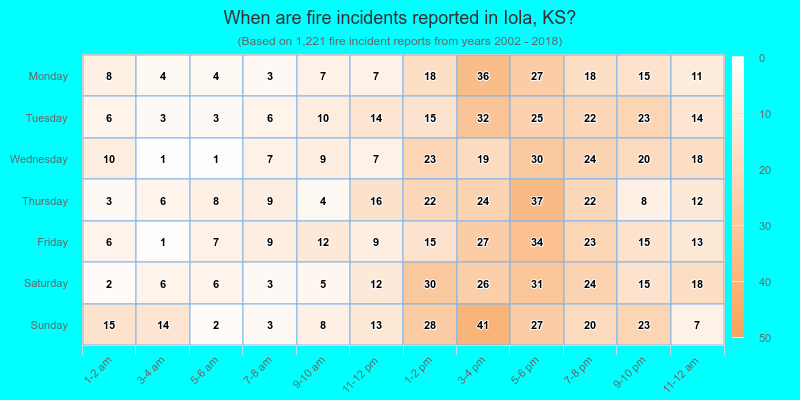
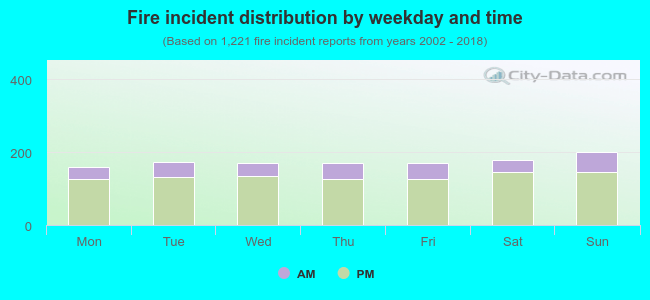 23.7% incidents where reported in the morning and 76.3% in the evening. The most fires (16.5%) took place on Sunday, and the least (12.9%) on Monday.
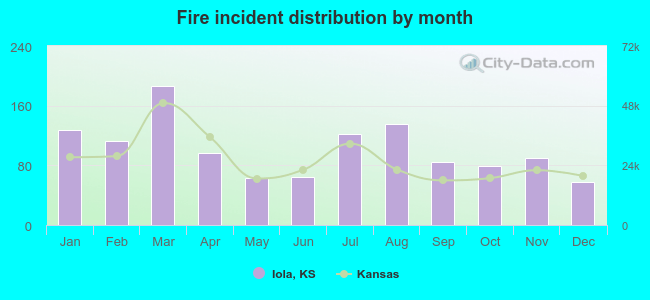 According to the 1,221 fires from years 2002 - 2018 most fires (15.3%) took place during March, and the least (4.8%) in December.
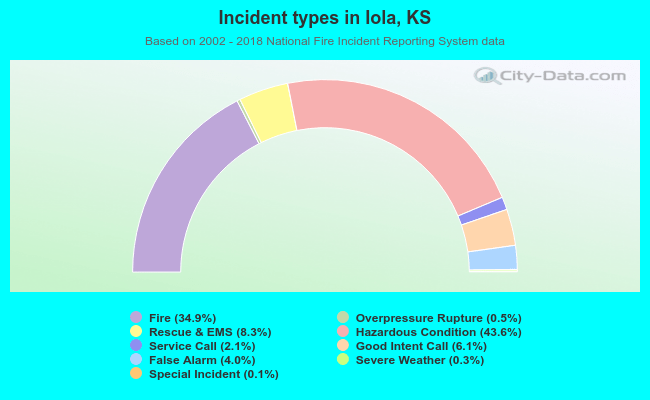 Out of all 3,499 cases reported during the years 2002 - 2018, the most belonged to the categories: Hazardous Condition (43.6%), Fire (34.9%), and Rescue & EMS (8.3%).
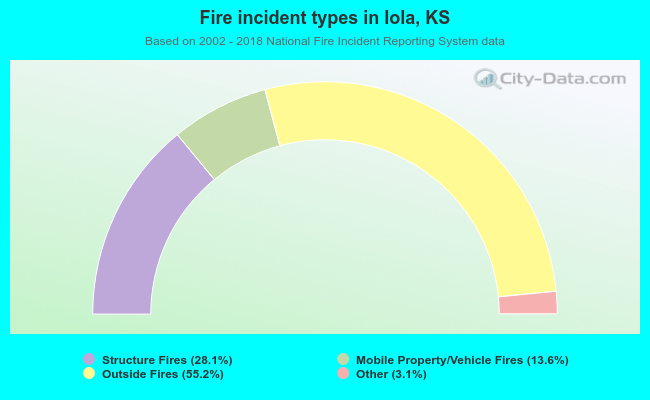 When looking into fire subcategories, the most reports belonged to: Outside Fires (55.2%), and Structure Fires (28.1%).