Ionia: Fire Incidents, Michigan (MI)
Where are fire incidents reported in Ionia, MI
Something went wrong! Please refresh the page.
| Fire incidents reported | |
|---|---|
| Sreet name | Count |
| STATE RD | 204 |
| MAIN ST | 126 |
| BLUEWATER HWY | 98 |
| RIVERSIDE DR | 94 |
| LINCOLN AVE | 90 |
| WASHINGTON ST | 78 |
| DEXTER ST | 58 |
| STAGE RD | 52 |
| STEELE ST | 48 |
| I-96 | 44 |
| TUTTLE RD | 42 |
| BEARDSLEY RD | 38 |
| DILDINE RD | 36 |
| JOHNSON RD | 36 |
| PORTLAND RD | 32 |
| BELLAMY RD | 30 |
| PARMETER RD | 30 |
| POTTERS RD | 30 |
| HAYNOR RD | 28 |
| SAYLES RD | 28 |
| NICKLEPLATE RD | 24 |
| WESTBROOK RD | 22 |
| BELLEVIEW DR | 20 |
| STATE ST | 20 |
| YEOMANS ST | 20 |
| I96 | 18 |
| JEFFERSON RD | 18 |
| KELSEY HWY | 18 |
| LAFAYETTE ST | 18 |
| STONE RD | 18 |
2002 - 2018 National Fire Incident Reporting System (NFIRS) incidents
- Incident types reported to NFIRS in Ionia, MI
- 1,41431.5%Hazardous Condition
- 1,40331.3%Fire
- 1,04123.2%Rescue & EMS
- 2335.2%False Alarm
- 1723.8%Good Intent Call
- 1543.4%Service Call
- 531.2%Severe Weather
- 110.2%Overpressure Rupture
- 70.2%Special Incident
- Fire incident types reported to NFIRS in Ionia, MI
- 56740.4%Structure Fires
- 47734.0%Outside Fires
- 24617.5%Mobile Property/Vehicle Fires
- 1138.1%Other
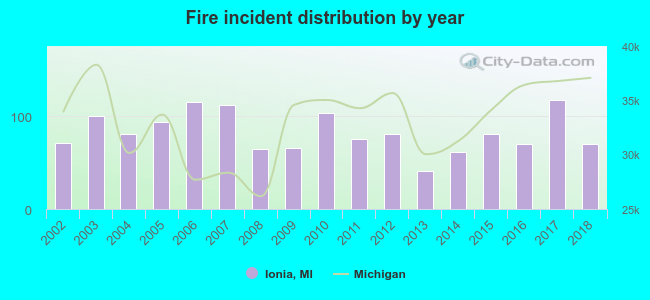 Based on the data from the years 2002 - 2018 the average number of fires per year is 83. The highest number of fires - 117 took place in 2017, and the least - 41 in 2013. The data has a declining trend.
The average number of yearly fire incidents per 10k residents in Ionia, MI compared to nearest cities:
(Note: Based on data for the last 3 years, including only cities with population 5,000 and above)
| Ionia: | 74.9 |
| Belding: | 102.6 |
| Greenville: | 71.6 |
| Grand Ledge: | 93.3 |
| Hastings: | 89.5 |
| Rockford: | 153.5 |
| East Grand Rapids: | 6.8 |
| Kentwood: | 22.3 |
| Grand Rapids: | 42.6 |
 The median response time based on all reported fire incidents is 6 minutes. This is similar to the state median value.
The median response time in Ionia, MI compared to nearest cities:
(Note: Based on data for all years, including only cities with at least 500 fire incidents)
| Ionia: | 6 minutes |
| Saranac: | 11 minutes |
| Belding: | 7 minutes |
| Lowell: | 8 minutes |
| Sheridan: | 9 minutes |
| Greenville: | 7 minutes |
| Grand Ledge: | 7 minutes |
| Hastings: | 10 minutes |
| Caledonia: | 8 minutes |
 According to the reports from the years 2002 - 2018 the average number of fire-related yearly casualties is 0. The highest number of injuries - 3 took place in 2012, and the lowest - 0 in 2003. The data has a dropping trend.
The average number of injuries per 1,000 fires is 5. This indicator was the highest - 37 in 2012, and the lowest 0 in 2003. The trend for casualties per 1,000 incidents is decreasing. Compared to the state value the number of injuries per 1,000 incidents is much lower.
According to the reports from the years 2002 - 2018 the average number of fire-related yearly casualties is 0. The highest number of injuries - 3 took place in 2012, and the lowest - 0 in 2003. The data has a dropping trend.
The average number of injuries per 1,000 fires is 5. This indicator was the highest - 37 in 2012, and the lowest 0 in 2003. The trend for casualties per 1,000 incidents is decreasing. Compared to the state value the number of injuries per 1,000 incidents is much lower.Casualties per 1,000 incidents in Ionia, MI compared to nearest cities:
(Note: Based on data for all years, including only cities with at least 500 fire incidents)
| Ionia: | 5.0 |
| Saranac: | 5.7 |
| Belding: | 7.4 |
| Lowell: | 2.5 |
| Sheridan: | 0.0 |
| Greenville: | 5.8 |
| Grand Ledge: | 10.7 |
| Hastings: | 9.6 |
| Caledonia: | 7.0 |
 32.1% incidents where reported in the morning and 67.9% in the evening. The most fires (16.3%) took place on Sunday, and the least (13.2%) on Thursday.
 Based on the 1,403 fires from years 2002 - 2018 most fires (14.5%) took place during April, and the least (5.5%) in December.
 Out of all 4,488 cases reported during the years 2002 - 2018, the most belonged to the categories: Hazardous Condition (31.5%), Fire (31.3%), and Rescue & EMS (23.2%).
 When looking into fire subcategories, the most incidents belonged to: Structure Fires (40.4%), and Outside Fires (34.0%).