Jerseyville: Fire Incidents, Illinois (IL)
Where are fire incidents reported in Jerseyville, IL
Something went wrong! Please refresh the page.
|
| |||||||||||||||||||||||||||||||||||||||||||||||||||||||||||||||||||||||||||||||||||||||||||||||||||||||||||||
| Other | 42 | |||||||||||||||||||||||||||||||||||||||||||||||||||||||||||||||||||||||||||||||||||||||||||||||||||||||||||||
2002 - 2018 National Fire Incident Reporting System (NFIRS) incidents
- Incident types reported to NFIRS in Jerseyville, IL
- 30247.7%Fire
- 18529.2%Rescue & EMS
- 7812.3%Good Intent Call
- 264.1%Hazardous Condition
- 264.1%Service Call
- 91.4%False Alarm
- 60.9%Special Incident
- 10.2%Severe Weather
- Fire incident types reported to NFIRS in Jerseyville, IL
- 16454.3%Structure Fires
- 8126.8%Outside Fires
- 5217.2%Mobile Property/Vehicle Fires
- 51.7%Other
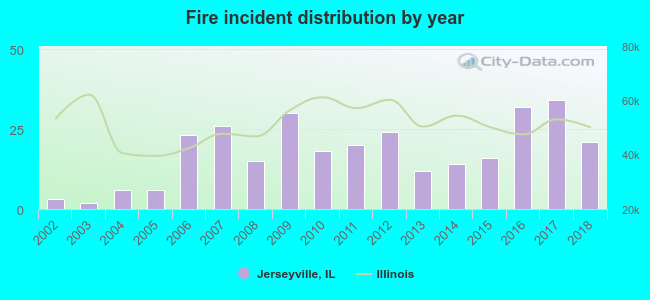 According to the data from the years 2002 - 2018 the average number of fire incidents per year is 18. The highest number of reported fire incidents - 34 took place in 2017, and the least - 2 in 2003. The data has a rising trend.
The average number of yearly fire incidents per 10k residents in Jerseyville, IL compared to nearest cities:
(Note: Based on data for the last 3 years, including only cities with population 5,000 and above)
| Jerseyville: | 34.0 |
| Godfrey: | 39.2 |
| Alton: | 67.8 |
| East Alton: | 107.8 |
| Bethalto: | 16.0 |
| Wood River: | 55.0 |
| Carlinville: | 72.4 |

 According to the data from the years 2002 - 2018 the average number of fire-related casualties per year is 0. The highest number of injuries - 2 took place in 2016, and the lowest - 0 in 2002. The data has a constant trend.
 32.1% incidents where reported in the morning and 67.9% in the evening. The most fires (18.9%) took place on Sunday, and the least (10.6%) on Tuesday.
 According to the 302 incident reports from years 2002 - 2018 most fires (13.9%) took place during February, and the least (3.6%) in May.
 Out of all 633 cases reported during the years 2002 - 2018, the most belonged to the categories: Fire (47.7%), Overpressure Rupture (29.2%), and Service Call (12.3%).
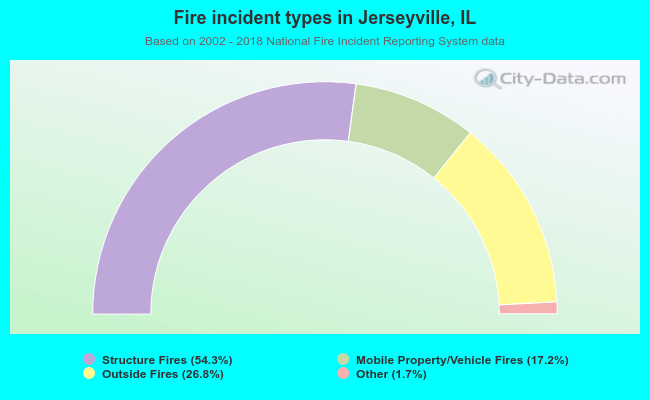 When looking into fire subcategories, the most reports belonged to: Structure Fires (54.3%), and Outside Fires (26.8%).