Johns Creek: Fire Incidents, Georgia (GA)
Where are fire incidents reported in Johns Creek, GA
Something went wrong! Please refresh the page.
| Fire incidents reported | |
|---|---|
| Sreet name | Count |
| STATE BRIDGE RD | 122 |
| MEDLOCK BRIDGE RD | 92 |
| JONES BRIDGE RD | 58 |
| OLD ALABAMA RD | 52 |
| ABBOTTS BRIDGE RD | 42 |
| BUICE RD | 28 |
| NESBIT FERRY RD | 26 |
| BELL RD | 22 |
| PARSONS RD | 22 |
| ADDISON LN | 18 |
| MCGINNIS FERRY RD | 18 |
| KIMBALL BRIDGE RD | 16 |
| HOLCOMB BRIDGE RD | 14 |
| OLD SOUTHWICK PASS | 12 |
| PRESTWICK CLUB DR | 12 |
| MORTON MANOR CT | 10 |
| VALAIS CT | 10 |
| WILLOW MEADOW CIR | 10 |
| ABBOTTS STATION DR | 8 |
| BANNERGATE DR | 8 |
| FAIRWAY RIDGE DR | 8 |
| FINDLEY RD | 8 |
| GROOMSBRIDGE RD | 8 |
| GROVEHURST DR | 8 |
| HAMPTON SQUARE DR | 8 |
| MERGANSER LN | 8 |
| ROD RD | 8 |
| TAYLOR RD | 8 |
| ABBOTTS MILL CT | 6 |
| ANCLOTE DR | 6 |
| Other | 253 |
2007 - 2018 National Fire Incident Reporting System (NFIRS) incidents
- Incident types reported to NFIRS in Johns Creek, GA
- 7,28439.6%Rescue & EMS
- 5,56930.3%Good Intent Call
- 1,94810.6%Service Call
- 1,5698.5%False Alarm
- 1,0435.7%Hazardous Condition
- 9295.1%Fire
- 210.1%Severe Weather
- Fire incident types reported to NFIRS in Johns Creek, GA
- 47350.9%Outside Fires
- 34236.8%Structure Fires
- 10211.0%Mobile Property/Vehicle Fires
- 121.3%Other
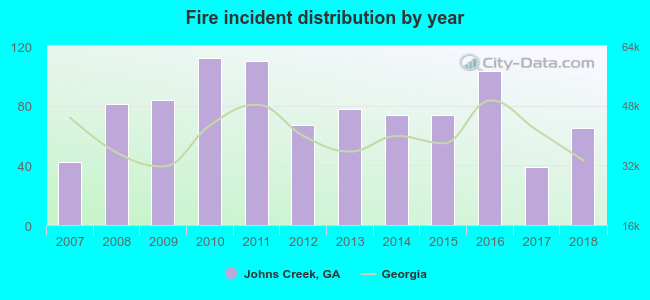 Based on the data from the years 2007 - 2018 the average number of fires per year is 77. The highest number of fires - 112 took place in 2010, and the least - 39 in 2017. The data has an increasing trend.
The average number of yearly fire incidents per 10k residents in Johns Creek, GA compared to nearest cities:
(Note: Based on data for the last 3 years, including only cities with population 5,000 and above)
| Johns Creek: | 8.3 |
| Duluth: | 65.1 |
| Alpharetta: | 29.3 |
| Norcross: | 137.6 |
| Suwanee: | 63.1 |
| Roswell: | 18.7 |
| Dunwoody: | 5.3 |
| Doraville: | 21.8 |
| Milton: | 24.2 |
 The median response time based on all reported fire incidents is 6 minutes. This is about the same as the state median value.
The median response time in Johns Creek, GA compared to nearest cities:
(Note: Based on data for all years, including only cities with at least 500 fire incidents)
| Johns Creek: | 6 minutes |
| Duluth: | 7 minutes |
| Alpharetta: | 5 minutes |
| Norcross: | 7 minutes |
| Suwanee: | 8 minutes |
| Roswell: | 6 minutes |
| Milton: | 6 minutes |
| Lilburn: | 7 minutes |
| Sandy Springs: | 6 minutes |
 Based on the reports from the years 2007 - 2018 the average number of fire-related yearly deaths is 0. The highest number of deaths - 1 took place in 2010, and the lowest - 0 in 2007. The data has a constant trend.
 According to the data from the years 2007 - 2018 the average number of fire-related yearly casualties is 1. The highest number of casualties - 3 took place in 2009, and the lowest - 0 in 2007. The data has a constant trend.
The average number of injuries per 1,000 fire incidents is 17. This indicator was the highest - 51 in 2017, and the lowest 0 in 2007. The trend for injuries per 1,000 fires is constant. Compared to the state value the number of casualties per 1,000 fires is higher.
According to the data from the years 2007 - 2018 the average number of fire-related yearly casualties is 1. The highest number of casualties - 3 took place in 2009, and the lowest - 0 in 2007. The data has a constant trend.
The average number of injuries per 1,000 fire incidents is 17. This indicator was the highest - 51 in 2017, and the lowest 0 in 2007. The trend for injuries per 1,000 fires is constant. Compared to the state value the number of casualties per 1,000 fires is higher.Casualties per 1,000 incidents in Johns Creek, GA compared to nearest cities:
(Note: Based on data for all years, including only cities with at least 500 fire incidents)
| Johns Creek: | 16.1 |
| Duluth: | 15.3 |
| Alpharetta: | 10.5 |
| Norcross: | 19.0 |
| Suwanee: | 10.3 |
| Roswell: | 19.4 |
| Milton: | 11.8 |
| Lilburn: | 30.1 |
| Sandy Springs: | 7.1 |
 25.0% incidents where reported in the morning and 75.0% in the evening. The most fires (18.6%) took place on Saturday, and the least (12.3%) on Monday.
 According to the 929 fire incident reports from years 2007 - 2018 most fires (10.2%) took place during May, and the least (6.4%) in September.
 Out of all 18,378 cases reported during the years 2007 - 2018, the most belonged to the categories: Rescue & EMS (39.6%), Good Intent Call (30.3%), and Service Call (10.6%).
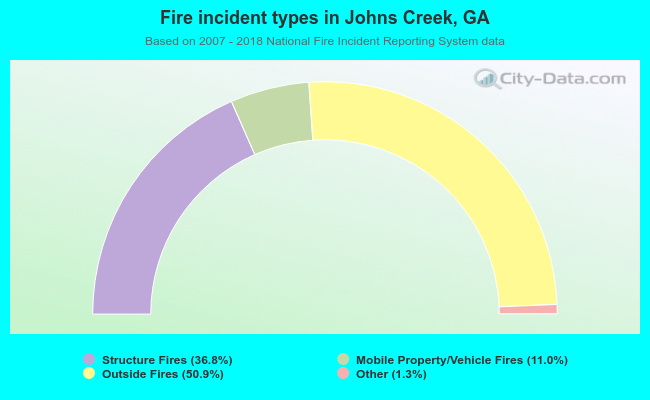 When looking into fire subcategories, the most reports belonged to: Outside Fires (50.9%), and Structure Fires (36.8%).