| Fire incidents reported |
|---|
| Sreet name | Count |
|---|
| INTERSTATE 55 | 26 | | FIRST ST | 16 | | HIGHWAY 61 | 12 | | FIRST STREET | 8 | | FELTS ST | 6 | | FORD ST | 6 | | HWY 118 | 6 | | I 55 | 6 | | INTERSTATE 55 HWY | 6 | | 118 HWY | 4 | | 35MM I55 | 4 | | BURNS ST | 4 | | COUNTY 267 RD | 4 | | COUNTY ROAD 267 | 4 | | HIGH-WAY 61 | 4 | | HWY 55 | 4 | | HWY 61 | 4 | | HWY-61 | 4 | | I55 | 4 | | INTERSTATE55 | 4 | | MAGNOLIA | 4 | | MAIN ST | 4 | | 101 MAGNOLIA | 2 | | 102 MAGNOLIA | 2 | | 104 GIN STREET | 2 |
| | | Fire incidents reported |
|---|
| Sreet name | Count |
|---|
| 105 MAIN | 2 | | 105 MAIN ST | 2 | | 105 MAIN STREET | 2 | | 1053 WCR | 2 | | 110 BURNES | 2 | | 115 HWY 118 | 2 | | 118 77 HWY | 2 | | 118 HWY | 2 | | 119 MAGNOLIA ST | 2 | | 122 WEST HWY 18 | 2 | | 126 BURNS | 2 | | 1539 SCR 245 | 2 | | 1613 WEST ST HWY 118 | 2 | | 1614 ST HWY 118 | 2 | | 1ST STREET | 2 | | 209 BLACKWELL STREET | 2 | | 226 NORTH HWY 61 | 2 | | 2441 HWY 181 | 2 | | 2548 W ST HWY 181 | 2 | | 300 FIRST STREET | 2 | | 301 1ST | 2 | | 304 HAYS | 2 | | 307ST STREET | 2 | | 31 MM I55 | 2 | | 313 FIRST STREET | 2 |
|
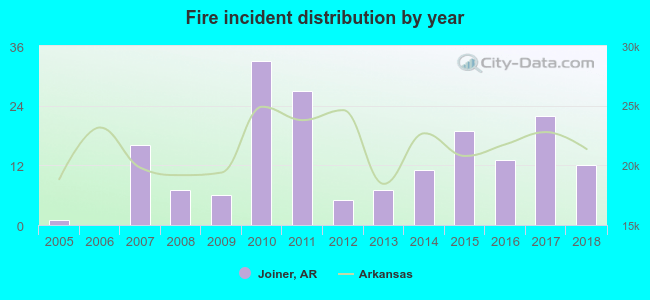 Based on the data from the years 2005 - 2018 the average number of fires per year is 13. The highest number of fire incidents - 33 took place in 2010, and the least - 0 in 2006. The data has a rising trend.
 36.3% incidents where reported in the morning and 63.7% in the evening. The most fires (21.8%) took place on Saturday, and the least (8.4%) on Thursday.
 Based on the 179 fire incident reports from years 2005 - 2018 most fires (16.8%) took place during October, and the least (3.9%) in February.
 Out of all 442 cases reported during the years 2005 - 2018, the most belonged to the categories: Overpressure Rupture (57.2%), Fire (40.5%), and Hazardous Condition (1.4%).
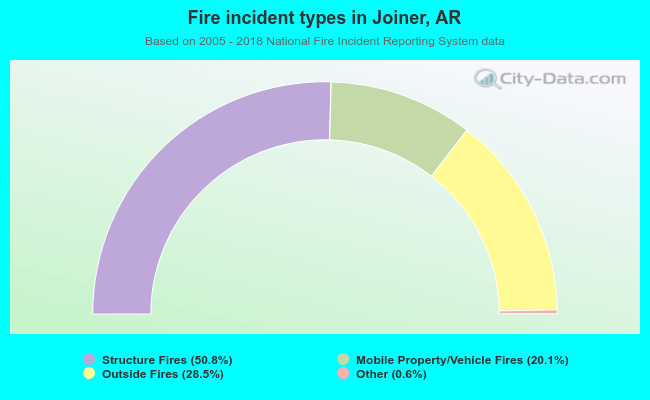 When looking into fire subcategories, the most incidents belonged to: Structure Fires (50.8%), and Outside Fires (28.5%).