Joliet: Fire Incidents, Illinois (IL)
Where are fire incidents reported in Joliet, IL
Something went wrong! Please refresh the page.
| Fire incidents reported | |
|---|---|
| Sreet name | Count |
| JEFFERSON ST | 234 |
| LARKIN AVE | 228 |
| JEFFERSON | 226 |
| PLAINFIELD RD | 200 |
| BROADWAY | 166 |
| BROADWAY ST | 164 |
| CHICAGO | 160 |
| CATON FARM RD | 154 |
| CASS ST | 152 |
| ROWELL AVE | 152 |
| WASHINGTON ST | 138 |
| LOIS PL | 132 |
| CHICAGO ST | 124 |
| CASS | 122 |
| PATTERSON RD | 122 |
| BLACK RD | 116 |
| ESSINGTON RD | 106 |
| BRIGGS ST | 98 |
| RAYNOR AVE | 98 |
| HOUBOLT RD | 94 |
| BLUFF ST | 88 |
| OTTAWA ST | 84 |
| LARAWAY RD | 80 |
| CENTER | 74 |
| MILLS RD | 72 |
| 2ND AVE | 70 |
| CENTER ST | 70 |
| EASTERN AVE | 70 |
| HICKORY | 68 |
| MCDONOUGH | 68 |
| Other | 4,115 |
2002 - 2018 National Fire Incident Reporting System (NFIRS) incidents
- Incident types reported to NFIRS in Joliet, IL
- 87,45571.8%Rescue & EMS
- 7,8456.4%Fire
- 7,4836.1%Hazardous Condition
- 7,2486.0%Good Intent Call
- 6,6115.4%False Alarm
- 4,8644.0%Service Call
- 1480.1%Special Incident
- Fire incident types reported to NFIRS in Joliet, IL
- 3,37243.0%Structure Fires
- 2,34829.9%Outside Fires
- 1,50819.2%Mobile Property/Vehicle Fires
- 6177.9%Other
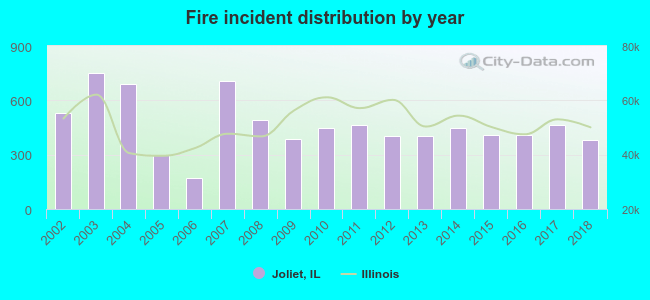 According to the data from the years 2002 - 2018 the average number of fires per year is 461. The highest number of reported fires - 751 took place in 2003, and the least - 171 in 2006. The data has a decreasing trend.
The average number of yearly fire incidents per 10k residents in Joliet, IL compared to nearest cities:
(Note: Based on data for the last 3 years, including only cities with population 5,000 and above)
| Joliet: | 28.1 |
| Crest Hill: | 23.6 |
| Lockport: | 43.1 |
| Shorewood: | 36.6 |
| New Lenox: | 36.1 |
| Romeoville: | 31.3 |
| Plainfield: | 40.4 |
| Channahon: | 43.1 |
| Minooka: | 54.8 |
 The median response time based on all reported fire incidents is 5 minutes. This is similar to the Illinois median value.
The median response time in Joliet, IL compared to nearest cities:
(Note: Based on data for all years, including only cities with at least 500 fire incidents)
| Joliet: | 5 minutes |
| Crest Hill: | 5 minutes |
| Lockport: | 5 minutes |
| Shorewood: | 5 minutes |
| New Lenox: | 6 minutes |
| Romeoville: | 5 minutes |
| Plainfield: | 6 minutes |
| Elwood: | 7 minutes |
| Channahon: | 7 minutes |
 According to the reports from the years 2002 - 2018 the average number of fire-related yearly deaths is 1. The highest number of reported deaths - 6 took place in 2004, and the lowest - 0 in 2002. The data has a constant trend.
The average number of fatalities per 1,000 fire incidents is 2. This indicator was the highest - 9 in 2004, and the lowest 0 in 2002. The trend for deaths per 1,000 fire incidents is constant. Compared to the Illinois value the number of fatalities per 1,000 fire incidents is about the same.
According to the reports from the years 2002 - 2018 the average number of fire-related yearly deaths is 1. The highest number of reported deaths - 6 took place in 2004, and the lowest - 0 in 2002. The data has a constant trend.
The average number of fatalities per 1,000 fire incidents is 2. This indicator was the highest - 9 in 2004, and the lowest 0 in 2002. The trend for deaths per 1,000 fire incidents is constant. Compared to the Illinois value the number of fatalities per 1,000 fire incidents is about the same.Deaths per 1,000 incidents in Joliet, IL compared to nearest cities:
(Note: Based on data for all years, including only cities with at least 2,500 fire incidents)
| Joliet: | 2.2 |
| Plainfield: | 1.2 |
| Bolingbrook: | 1.0 |
| Naperville: | 1.0 |
| Aurora: | 4.4 |
 Based on the reports from the years 2002 - 2018 the average number of fire-related yearly casualties is 2. The highest number of reported casualties - 13 took place in 2004, and the lowest - 0 in 2009. The data has a decreasing trend.
The average number of injuries per 1,000 fire incidents is 4. This indicator was the highest - 19 in 2004, and the lowest 0 in 2009. The trend for casualties per 1,000 fire incidents is declining. Compared to the Illinois value the number of casualties per 1,000 fire incidents is much lower.
Based on the reports from the years 2002 - 2018 the average number of fire-related yearly casualties is 2. The highest number of reported casualties - 13 took place in 2004, and the lowest - 0 in 2009. The data has a decreasing trend.
The average number of injuries per 1,000 fire incidents is 4. This indicator was the highest - 19 in 2004, and the lowest 0 in 2009. The trend for casualties per 1,000 fire incidents is declining. Compared to the Illinois value the number of casualties per 1,000 fire incidents is much lower.Casualties per 1,000 incidents in Joliet, IL compared to nearest cities:
(Note: Based on data for all years, including only cities with at least 500 fire incidents)
| Joliet: | 4.2 |
| Crest Hill: | 11.5 |
| Lockport: | 16.0 |
| Shorewood: | 7.2 |
| New Lenox: | 3.6 |
| Romeoville: | 12.2 |
| Plainfield: | 8.0 |
| Elwood: | 1.7 |
| Channahon: | 1.1 |
 33.3% incidents where reported in the morning and 66.7% in the evening. The most fires (15.7%) took place on Sunday, and the least (13.2%) on Wednesday.
 According to the 7,845 fire incidents from years 2002 - 2018 most fires (11.2%) took place during July, and the least (6.1%) in February.
 Out of all 121,729 cases reported during the years 2002 - 2018, the most belonged to the categories: Rescue & EMS (71.8%), Fire (6.4%), and Hazardous Condition (6.1%).
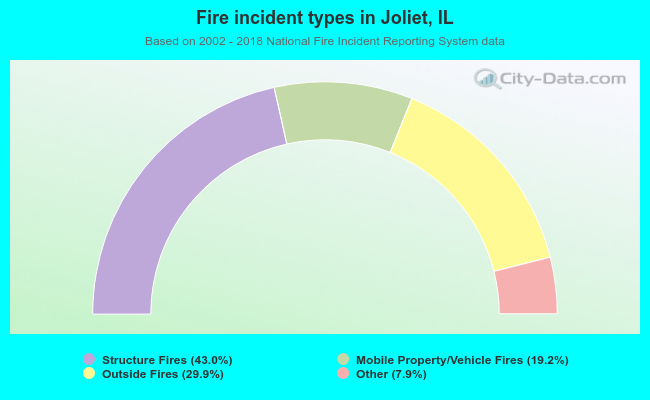 When looking into fire subcategories, the most reports belonged to: Structure Fires (43.0%), and Outside Fires (29.9%).