Jones: Fire Incidents, Oklahoma (OK)
Where are fire incidents reported in Jones, OK
Something went wrong! Please refresh the page.
|
| |||||||||||||||||||||||||||||||||||||||||||||||||||||||||||||||||||||||||||||||||||||||||||||||||||||||||||||
2005 - 2018 National Fire Incident Reporting System (NFIRS) incidents
- Incident types reported to NFIRS in Jones, OK
- 1,10236.7%Good Intent Call
- 91530.5%Rescue & EMS
- 58419.5%Fire
- 1685.6%Service Call
- 1555.2%Hazardous Condition
- 672.2%False Alarm
- 40.1%Severe Weather
- 30.1%Special Incident
- Fire incident types reported to NFIRS in Jones, OK
- 38565.9%Outside Fires
- 13222.6%Structure Fires
- 6010.3%Mobile Property/Vehicle Fires
- 71.2%Other
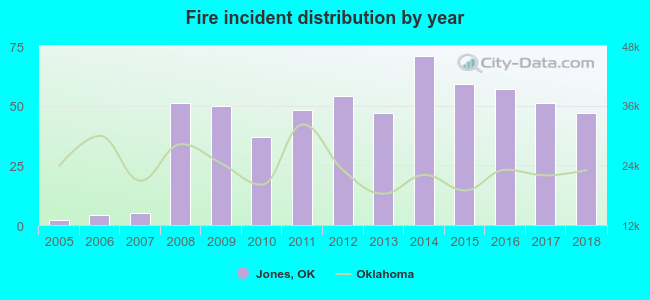 Based on the data from the years 2005 - 2018 the average number of fires per year is 42. The highest number of fires - 71 took place in 2014, and the least - 2 in 2005. The data has an increasing trend.
 The median response time based on all reported fire incidents is 8 minutes. This is higher compared to the state median value.
The median response time in Jones, OK compared to nearest cities:
(Note: Based on data for all years, including only cities with at least 500 fire incidents)
| Jones: | 8 minutes |
| Choctaw: | 6 minutes |
| Spencer: | 4 minutes |
| Harrah: | 7 minutes |
| Luther: | 10 minutes |
| Midwest City: | 5 minutes |
| Edmond: | 6 minutes |
| Del City: | 3 minutes |
| Oklahoma City: | 5 minutes |
 25.0% incidents where reported in the morning and 75.0% in the evening. The most fires (18.8%) took place on Saturday, and the least (9.9%) on Tuesday.
 According to the 584 reports from years 2005 - 2018 most fires (13.5%) took place during January, and the least (4.8%) in May.
 Out of all 2,999 cases reported during the years 2005 - 2018, the most belonged to the categories: Good Intent Call (36.7%), Rescue & EMS (30.5%), and Fire (19.5%).
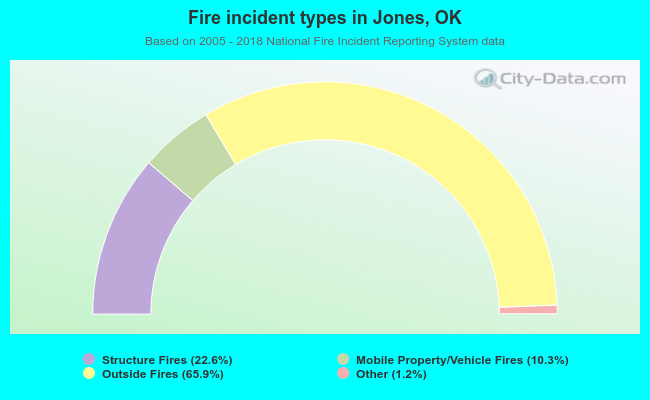 When looking into fire subcategories, the most reports belonged to: Outside Fires (65.9%), and Structure Fires (22.6%).