Jonesboro: Fire Incidents, Indiana (IN)
Where are fire incidents reported in Jonesboro, IN
Something went wrong! Please refresh the page.
|
| |||||||||||||||||||||||||||||||||||||||||||||||||||||||||||||||||||||||||||||||||||||||||||||||||||||||||||||
| Other | 27 | |||||||||||||||||||||||||||||||||||||||||||||||||||||||||||||||||||||||||||||||||||||||||||||||||||||||||||||
2002 - 2018 National Fire Incident Reporting System (NFIRS) incidents
- Incident types reported to NFIRS in Jonesboro, IN
- 24937.4%Fire
- 21131.7%Rescue & EMS
- 6710.1%Hazardous Condition
- 477.1%Service Call
- 466.9%Severe Weather
- 213.2%False Alarm
- 152.3%Good Intent Call
- 91.4%Special Incident
- 10.2%Overpressure Rupture
- Fire incident types reported to NFIRS in Jonesboro, IN
- 11345.4%Structure Fires
- 9437.8%Outside Fires
- 2811.2%Other
- 145.6%Mobile Property/Vehicle Fires
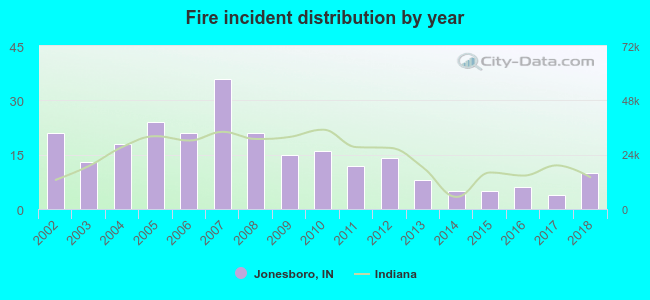 Based on the data from the years 2002 - 2018 the average number of fires per year is 15. The highest number of fire incidents - 36 took place in 2007, and the least - 4 in 2017. The data has a decreasing trend.
 31.3% incidents where reported in the morning and 68.7% in the evening. The most fires (20.1%) took place on Thursday, and the least (9.6%) on Sunday.
 According to the 249 incident reports from years 2002 - 2018 most fires (10.8%) took place during March, and the least (4.8%) in September.
 Out of all 666 cases reported during the years 2002 - 2018, the most belonged to the categories: Fire (37.4%), Rescue & EMS (31.7%), and Hazardous Condition (10.1%).
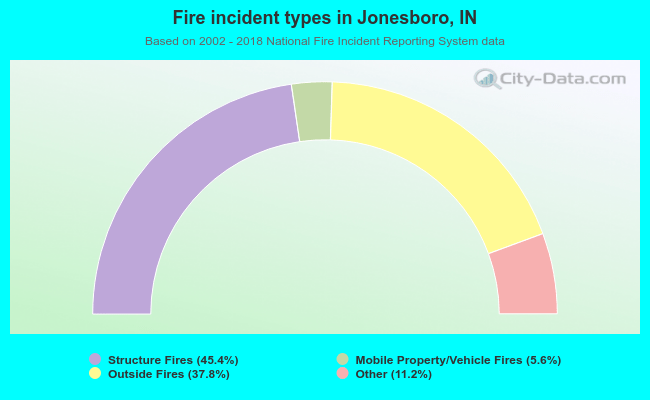 When looking into fire subcategories, the most incidents belonged to: Structure Fires (45.4%), and Outside Fires (37.8%).