Kahoka: Fire Incidents, Missouri (MO)
Where are fire incidents reported in Kahoka, MO
Something went wrong! Please refresh the page.
|
| |||||||||||||||||||||||||||||||||||||||||||||||||||||||||||||||||||||||||||||||||||||||||||||||||||||||||||||
| Other | 56 | |||||||||||||||||||||||||||||||||||||||||||||||||||||||||||||||||||||||||||||||||||||||||||||||||||||||||||||
2002 - 2018 National Fire Incident Reporting System (NFIRS) incidents
- Incident types reported to NFIRS in Kahoka, MO
- 28281.3%Fire
- 4513.0%Hazardous Condition
- 133.7%Good Intent Call
- 20.6%Rescue & EMS
- 20.6%Service Call
- 10.3%Overpressure Rupture
- 10.3%False Alarm
- 10.3%Special Incident
- Fire incident types reported to NFIRS in Kahoka, MO
- 12544.3%Outside Fires
- 9834.8%Structure Fires
- 5017.7%Mobile Property/Vehicle Fires
- 93.2%Other
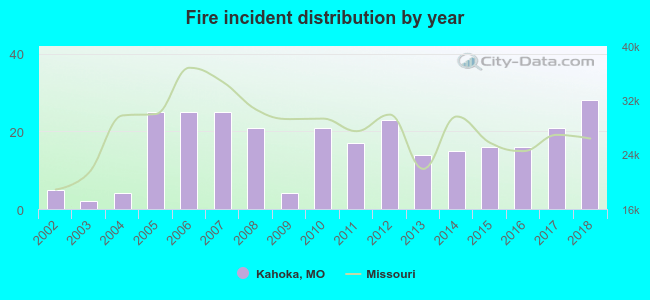 Based on the data from the years 2002 - 2018 the average number of fire incidents per year is 17. The highest number of fires - 28 took place in 2018, and the least - 2 in 2003. The data has a growing trend.
 29.1% incidents where reported in the morning and 70.9% in the evening. The most fires (18.8%) took place on Saturday, and the least (10.3%) on Wednesday.
 According to the 282 fire incidents from years 2002 - 2018 most fires (14.5%) took place during April, and the least (3.2%) in May.
 Out of all 347 cases reported during the years 2002 - 2018, the most belonged to the categories: Fire (81.3%), Hazardous Condition (13.0%), and Good Intent Call (3.7%).
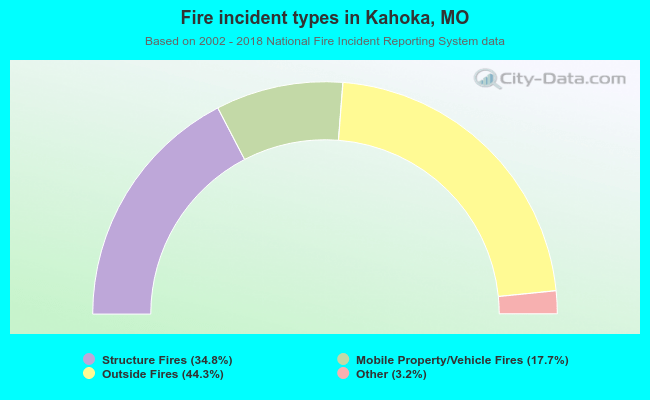 When looking into fire subcategories, the most incidents belonged to: Outside Fires (44.3%), and Structure Fires (34.8%).