Kapolei: Fire Incidents, Hawaii (HI)
Where are fire incidents reported in Kapolei, HI
Something went wrong! Please refresh the page.
| Fire incidents reported | |
|---|---|
| Sreet name | Count |
| FARRINGTON HWY | 498 |
| CORAL SEA RD | 178 |
| MAKAKILO DR | 164 |
| KAPOLEI PKY | 152 |
| KAMOKILA BLVD | 142 |
| MALAKOLE ST | 134 |
| HANUA ST | 126 |
| H1 FWY | 106 |
| PANANA ST | 106 |
| FORT BARRETTE RD | 82 |
| KALAELOA BLVD | 64 |
| KAMAAHA LOOP | 62 |
| OLAI ST | 62 |
| SARATOGA AVE | 62 |
| FRANKLIN D ROOSEVELT AVE | 52 |
| KAOMI LP | 52 |
| KAMAAHA LP | 50 |
| BOXER RD | 48 |
| MANAWAI ST | 46 |
| PALAHIA ST | 46 |
| TRIPOLI ST | 46 |
| ALIINUI DR | 44 |
| KOMOHANA ST | 44 |
| RENTON RD | 44 |
| LAUWILIWILI ST | 40 |
| MIDWAY RD | 40 |
| HAUMEA ST | 38 |
| FD ROOSEVELT AVE | 34 |
| ENTERPRISE AVE | 32 |
| KAOMI LOOP | 32 |
2003 - 2018 National Fire Incident Reporting System (NFIRS) incidents
- Incident types reported to NFIRS in Kapolei, HI
- 6,31649.6%Rescue & EMS
- 2,06316.2%Fire
- 1,71713.5%Good Intent Call
- 1,2579.9%Hazardous Condition
- 1,0168.0%False Alarm
- 3542.8%Service Call
- Fire incident types reported to NFIRS in Kapolei, HI
- 1,36566.2%Outside Fires
- 39919.3%Mobile Property/Vehicle Fires
- 29214.2%Structure Fires
- 70.3%Other
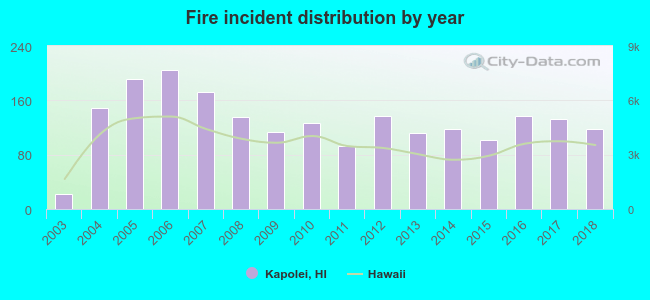 Based on the data from the years 2003 - 2018 the average number of fires per year is 129. The highest number of fire incidents - 205 took place in 2006, and the least - 22 in 2003. The data has a growing trend.
The average number of yearly fire incidents per 10k residents in Kapolei, HI compared to nearest cities:
(Note: Based on data for the last 3 years, including only cities with population 5,000 and above)
| Kapolei: | 85.2 |
| Makakilo: | 2.7 |
| Ewa Beach: | 50.4 |
| Waipahu: | 36.5 |
| Nanakuli: | 7.6 |
| Waipio: | 11.1 |
| Pearl City: | 13.9 |
| Mililani Town: | 6.3 |
| Maili: | 12.6 |
 The median response time based on all reported fire incidents is 7 minutes. This is similar to the Hawaii median value.
The median response time in Kapolei, HI compared to nearest cities:
(Note: Based on data for all years, including only cities with at least 500 fire incidents)
| Kapolei: | 7 minutes |
| Ewa Beach: | 7 minutes |
| Waipahu: | 7 minutes |
| Pearl City: | 7 minutes |
| Mililani Town: | 6 minutes |
| Aiea: | 7 minutes |
| Waianae: | 7 minutes |
| Wahiawa: | 6 minutes |
| Honolulu: | 5 minutes |
 According to the reports from the years 2003 - 2018 the average number of fire-related yearly casualties is 1. The highest number of casualties - 3 took place in 2007, and the lowest - 0 in 2003. The data has a growing trend.
The average number of injuries per 1,000 fires is 5. This indicator was the highest - 17 in 2007, and the lowest 0 in 2003. The trend for injuries per 1,000 incidents is increasing. Compared to the state value the number of injuries per 1,000 fires is higher.
According to the reports from the years 2003 - 2018 the average number of fire-related yearly casualties is 1. The highest number of casualties - 3 took place in 2007, and the lowest - 0 in 2003. The data has a growing trend.
The average number of injuries per 1,000 fires is 5. This indicator was the highest - 17 in 2007, and the lowest 0 in 2003. The trend for injuries per 1,000 incidents is increasing. Compared to the state value the number of injuries per 1,000 fires is higher.Casualties per 1,000 incidents in Kapolei, HI compared to nearest cities:
(Note: Based on data for all years, including only cities with at least 500 fire incidents)
| Kapolei: | 6.3 |
| Ewa Beach: | 8.1 |
| Waipahu: | 11.4 |
| Pearl City: | 12.2 |
| Mililani Town: | 6.9 |
| Aiea: | 8.3 |
| Waianae: | 1.4 |
| Wahiawa: | 8.7 |
| Honolulu: | 9.7 |
 35.1% incidents where reported in the morning and 64.9% in the evening. The most fires (17.0%) took place on Saturday, and the least (13.2%) on Wednesday.
 Based on the 2,063 fires from years 2003 - 2018 most fires (13.8%) took place during July, and the least (5.4%) in February.
 Out of all 12,727 cases reported during the years 2003 - 2018, the most belonged to the categories: Rescue & EMS (49.6%), Fire (16.2%), and Good Intent Call (13.5%).
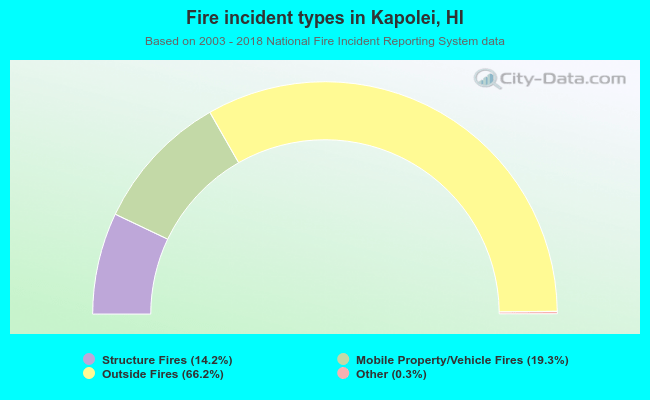 When looking into fire subcategories, the most incidents belonged to: Outside Fires (66.2%), and Mobile Property/Vehicle Fires (19.3%).