Killingly: Fire Incidents, Connecticut (CT)
Where are fire incidents reported in Killingly, CT
Something went wrong! Please refresh the page.
|
| |||||||||||||||||||||||||||||||||||||||||||||||||||||||||||||||||||||||||||||||||||||||||||||||||||||||||||||
2002 - 2018 National Fire Incident Reporting System (NFIRS) incidents
- Incident types reported to NFIRS in Killingly, CT
- 11939.9%Fire
- 8628.9%Rescue & EMS
- 4414.8%Hazardous Condition
- 217.0%Service Call
- 186.0%Good Intent Call
- 82.7%False Alarm
- 20.7%Severe Weather
- Fire incident types reported to NFIRS in Killingly, CT
- 8873.9%Structure Fires
- 1916.0%Outside Fires
- 86.7%Mobile Property/Vehicle Fires
- 43.4%Other
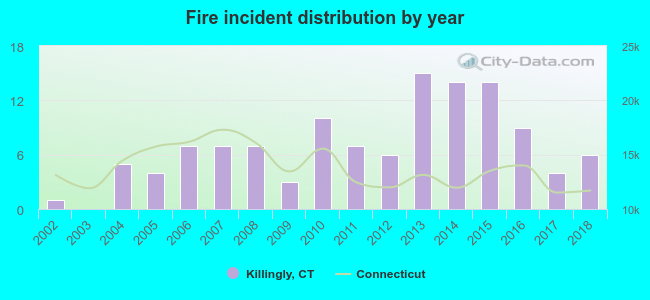 Based on the data from the years 2002 - 2018 the average number of fire incidents per year is 7. The highest number of reported fire incidents - 15 took place in 2013, and the least - 0 in 2003. The data has a growing trend.
The average number of yearly fire incidents per 10k residents in Killingly, CT compared to nearest cities:
(Note: Based on data for the last 3 years, including only cities with population 5,000 and above)
| Killingly: | 3.6 |
| Brooklyn: | 54.4 |
| Putnam: | 41.7 |
| Plainfield: | 14.5 |
| Thompson: | 27.5 |
| Canterbury: | 63.7 |
| Woodstock: | 18.8 |
| Griswold: | 76.7 |
| Windham: | 5.9 |
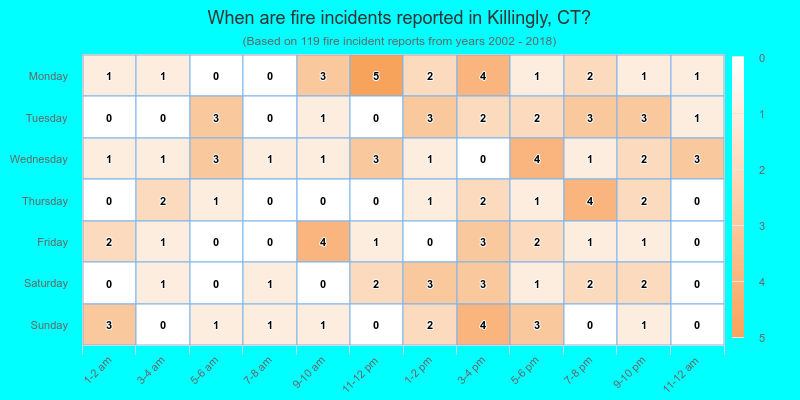
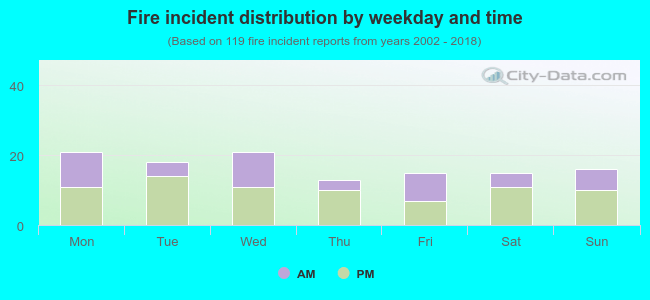 37.8% incidents where reported in the morning and 62.2% in the evening. The most fires (17.6%) took place on Monday, and the least (10.9%) on Thursday.
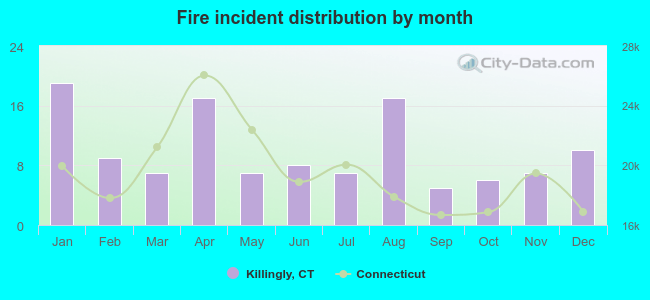 According to the 119 incident reports from years 2002 - 2018 most fires (16.0%) took place during January, and the least (4.2%) in September.
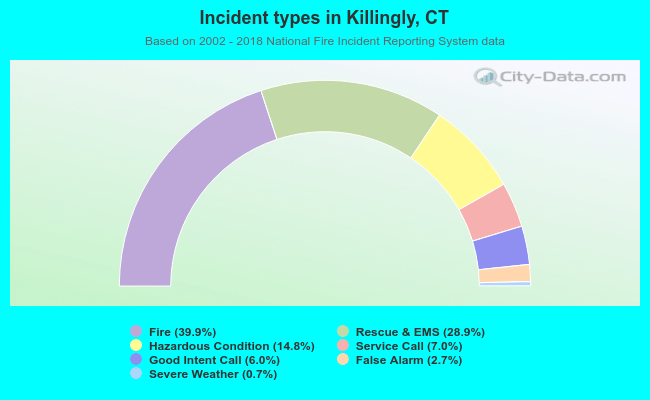 Out of all 298 cases reported during the years 2002 - 2018, the most belonged to the categories: Fire (39.9%), Overpressure Rupture (28.9%), and Rescue & EMS (14.8%).
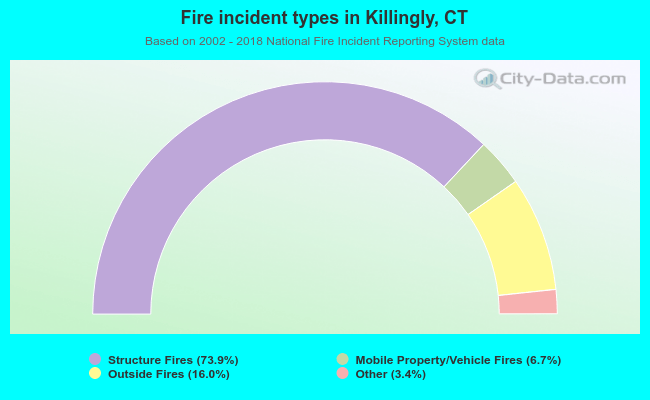 When looking into fire subcategories, the most incidents belonged to: Structure Fires (73.9%), and Outside Fires (16.0%).