| Fire incidents reported |
|---|
| Sreet name | Count |
|---|
| LITTLE BOSTON RD | 42 | | HANSVILLE RD | 40 | | MILLER BAY RD | 30 | | STATE HWY 104 | 30 | | WASHINGTON BLVD | 28 | | WEST KINGSTON RD | 18 | | MARINE VIEW DR | 16 | | OHIO AVE | 16 | | BEAR RIDGE DR | 12 | | RASH RD | 12 | | BARBER CUT OFF RD | 10 | | EGLON RD | 10 | | HOOD CANAL DR | 10 | | JEFFERSON POINT RD | 10 | | SOUTH KINGSTON RD | 10 | | BURKES LN NE | 8 | | DOUGLAS DR | 8 | | EAGLEWOOD LN | 8 | | FIRWOOD RD | 8 | | HANSVILLE RD NE | 8 | | HIGHLAND RD | 8 | | NEAT AVE | 8 | | PORT GAMBLE RD | 8 | | SEATTER RD | 8 | | STATE HWY 104 HWY | 8 |
| | | Fire incidents reported |
|---|
| Sreet name | Count |
|---|
| BOND RD | 6 | | BOSTON LN | 6 | | CHRIS LN | 6 | | GAMBLE BAY RD | 6 | | HILLBEND LN | 6 | | HOWARD AVE | 6 | | ILLINOIS AVE | 6 | | IRONWOOD LN | 6 | | JEFFERSON BEACH RD | 6 | | KINGSTON FARM RD | 6 | | KLOOMACHIN PL | 6 | | LINDVOG RD | 6 | | MINDER RD | 6 | | SANDY BEACH LN | 6 | | SIYAYA AVE | 6 | | STATE HY 104 | 6 | | TULIN RD | 6 | | 288TH ST | 4 | | BARRETT RD | 4 | | BORDER WAY | 4 | | CENTRAL AVE NORTH | 4 | | COUNTRY WOODS LN | 4 | | ECOLOGY RD | 4 | | HUSKY LN | 4 | | KITSAP | 4 |
|
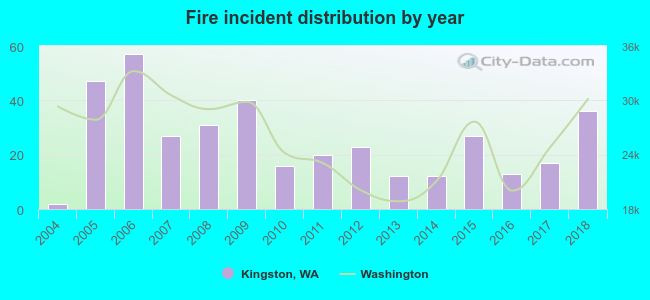 According to the data from the years 2004 - 2018 the average number of fires per year is 25. The highest number of reported fires - 57 took place in 2006, and the least - 2 in 2004. The data has an increasing trend.
 32.0% incidents where reported in the morning and 68.0% in the evening. The most fires (18.6%) took place on Thursday, and the least (11.5%) on Sunday.
 According to the 381 reports from years 2004 - 2018 most fires (15.5%) took place during July, and the least (4.2%) in November.
 Out of all 5,066 cases reported during the years 2004 - 2018, the most belonged to the categories: Rescue & EMS (51.7%), Hazardous Condition (13.6%), and Good Intent Call (12.4%).
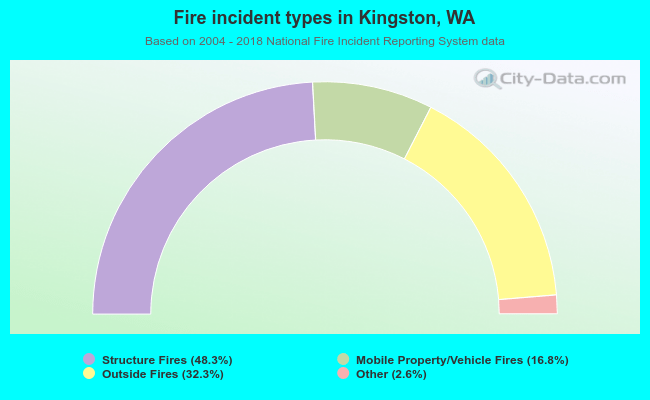 When looking into fire subcategories, the most incidents belonged to: Structure Fires (48.3%), and Outside Fires (32.3%).