Kula: Fire Incidents, Hawaii (HI)
Where are fire incidents reported in Kula, HI
Something went wrong! Please refresh the page.
|
| |||||||||||||||||||||||||||||||||||||||||||||||||||||||||||||||||||||||||||||||||||||||||||||||||||||||||||||
2002 - 2018 National Fire Incident Reporting System (NFIRS) incidents
- Incident types reported to NFIRS in Kula, HI
- 1,26643.1%Rescue & EMS
- 46615.9%Good Intent Call
- 46515.8%Fire
- 36312.4%Service Call
- 2378.1%Hazardous Condition
- 1384.7%False Alarm
- Fire incident types reported to NFIRS in Kula, HI
- 22348.0%Outside Fires
- 16735.9%Mobile Property/Vehicle Fires
- 7516.1%Structure Fires
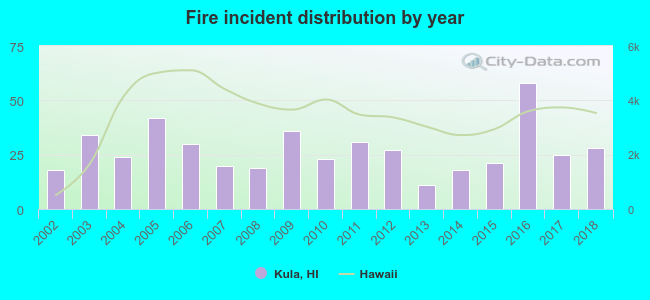 According to the data from the years 2002 - 2018 the average number of fires per year is 27. The highest number of reported fires - 58 took place in 2016, and the least - 11 in 2013. The data has a growing trend.
The average number of yearly fire incidents per 10k residents in Kula, HI compared to nearest cities:
(Note: Based on data for the last 3 years, including only cities with population 5,000 and above)
| Kula: | 34.5 |
| Kihei: | 28.1 |
| Pukalani: | 20.2 |
| Makawao: | 20.4 |
| Kahului: | 29.2 |
| Wailuku: | 23.3 |
| Lahaina: | 60.1 |
| Waimea: | 11.6 |
| Kailua: | 43.7 |

 42.2% incidents where reported in the morning and 57.8% in the evening. The most fires (16.3%) took place on Sunday, and the least (12.0%) on Tuesday.
 Based on the 465 fire incident reports from years 2002 - 2018 most fires (13.1%) took place during July, and the least (5.2%) in March.
 Out of all 2,936 cases reported during the years 2002 - 2018, the most belonged to the categories: Overpressure Rupture (43.1%), Service Call (15.9%), and Fire (15.8%).
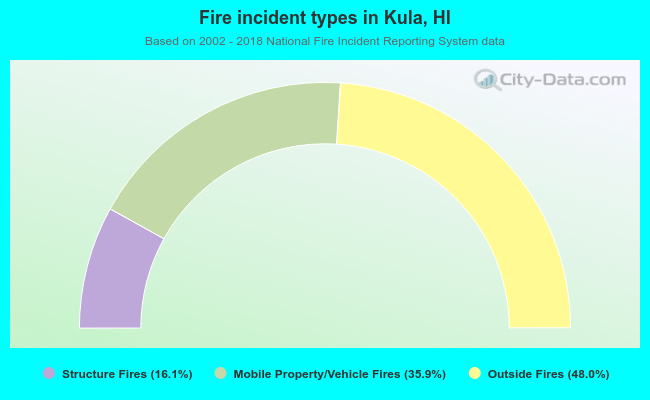 When looking into fire subcategories, the most reports belonged to: Outside Fires (48.0%), and Mobile Property/Vehicle Fires (35.9%).