| Fire incidents reported |
|---|
| Sreet name | Count |
|---|
| SAN ANDREAS RD | 24 | | HIGHWAY 1 | 12 | | SEASCAPE RESORT DR | 10 | | ALTA DR | 6 | | LARKIN VALLEY RD | 6 | | MAR MONTE AVE | 6 | | NB SR 1 | 6 | | SB SR 1 | 6 | | SEASCAPE RIDGE DR | 6 | | SUMNER AVE | 6 | | VIA PACIFICA | 6 | | VISTA DR | 6 | | AQUA VIEW DR | 4 | | NB SR 1 S OF SAN AND | 4 | | NB SR 1&MAR MONTE AVE | 4 | | PLAYA BL | 4 | | RACE HORSE LN | 4 | | SAND DOLLAR DR | 4 | | SAND DOLLAR DR/SAN ANDREA | 4 | | SB SR 1&VISTA POINT | 4 | | TIBURON CT | 4 | | VENTANA WY | 4 | | VIA TRINITA | 4 | | 5TH AVE | 2 | | ANITA AVE | 2 |
| | | Fire incidents reported |
|---|
| Sreet name | Count |
|---|
| ASTA DR | 2 | | BARRETTROBAK | 2 | | BONITA DR&SAN ANDREAS RD | 2 | | BUENA VISTA DR | 2 | | BUENA VISTA DR&WHISKEY HI | 2 | | CALYPSO DR | 2 | | CAMINO AL BARRANCO | 2 | | CANON DEL SOL | 2 | | DOLPHIN DR | 2 | | DOLPHIN DR&BOWSPRIT DR | 2 | | E BEL MAR DR | 2 | | EL PINAR | 2 | | HOLIDAY DR | 2 | | LARKIN RIDGE DR | 2 | | LARKIN VALLEY RD&MAR MONT | 2 | | LARKIN VALLEY RD&XANTHUS DR | 2 | | LILLY WY | 2 | | MAR MONTE AVE&LARKIN VALL | 2 | | MARGARITA RD | 2 | | MOON VALLEY RANCH RD | 2 | | MOON VALLEY RANCH RD&LARK | 2 | | NB SR 1 N OF SAN AND | 2 | | NB SR 1 S OF MAR MONTE | 2 | | OCEANVIEW DR&SAN ANDREAS RD | 2 | | |
|
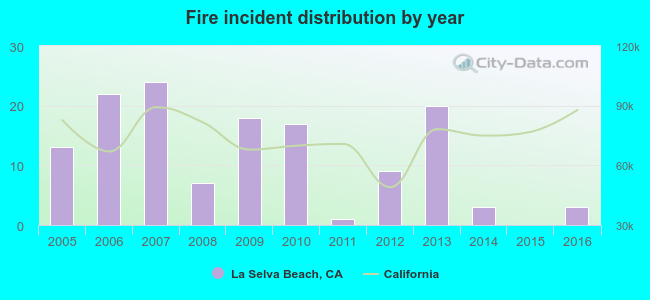 Based on the data from the years 2005 - 2016 the average number of fire incidents per year is 11. The highest number of fire incidents - 24 took place in 2007, and the least - 0 in 2015. The data has a declining trend.
 27.0% incidents where reported in the morning and 73.0% in the evening. The most fires (17.5%) took place on Saturday, and the least (11.7%) on Friday.
 According to the 137 incident reports from years 2005 - 2016 most fires (14.6%) took place during February, and the least (3.6%) in November.
 Out of all 478 cases reported during the years 2005 - 2016, the most belonged to the categories: Fire (28.7%), Overpressure Rupture (21.8%), and Rescue & EMS (21.8%).
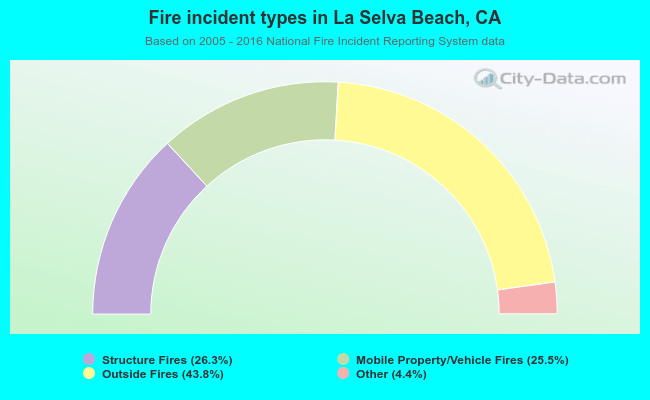 When looking into fire subcategories, the most incidents belonged to: Outside Fires (43.8%), and Structure Fires (26.3%).