Lafayette: Fire Incidents, California (CA)
Where are fire incidents reported in Lafayette, CA
Something went wrong! Please refresh the page.
|
| |||||||||||||||||||||||||||||||||||||||||||||||||||||||||||||||||||||||||||||||||||||||||||||||||||||||||||||
2004 - 2018 National Fire Incident Reporting System (NFIRS) incidents
- Incident types reported to NFIRS in Lafayette, CA
- 2,69950.7%Rescue & EMS
- 99718.7%Good Intent Call
- 54010.1%Hazardous Condition
- 5159.7%Fire
- 3266.1%False Alarm
- 2414.5%Service Call
- 60.1%Special Incident
- Fire incident types reported to NFIRS in Lafayette, CA
- 18435.7%Outside Fires
- 18135.1%Structure Fires
- 11923.1%Mobile Property/Vehicle Fires
- 316.0%Other
 Based on the data from the years 2004 - 2018 the average number of fire incidents per year is 34. The highest number of fire incidents - 70 took place in 2017, and the least - 1 in 2013. The data has a rising trend.
The average number of yearly fire incidents per 10k residents in Lafayette, CA compared to nearest cities:
(Note: Based on data for the last 3 years, including only cities with population 5,000 and above)
| Lafayette: | 18.8 |
| Moraga: | 14.9 |
| Orinda: | 26.1 |
| Walnut Creek: | 13.3 |
| Pleasant Hill: | 25.1 |
| Alamo: | 12.1 |
| Concord: | 16.0 |
| Martinez: | 21.8 |
| Briones: | 1.5 |
 The median response time based on all reported fire incidents is 7 minutes. This is similar to the California median value.
The median response time in Lafayette, CA compared to nearest cities:
(Note: Based on data for all years, including only cities with at least 500 fire incidents)
| Lafayette: | 7 minutes |
| Walnut Creek: | 6 minutes |
| Pleasant Hill: | 6 minutes |
| Concord: | 6 minutes |
| Martinez: | 7 minutes |
| Berkeley: | 5 minutes |
| Oakland: | 5 minutes |
| Danville: | 6 minutes |
| Albany: | 4 minutes |
 32.0% incidents where reported in the morning and 68.0% in the evening. The most fires (17.3%) took place on Friday, and the least (11.3%) on Monday.
 Based on the 515 reports from years 2004 - 2018 most fires (13.8%) took place during July, and the least (5.4%) in February.
 Out of all 5,326 cases reported during the years 2004 - 2018, the most belonged to the categories: Rescue & EMS (50.7%), Good Intent Call (18.7%), and Hazardous Condition (10.1%).
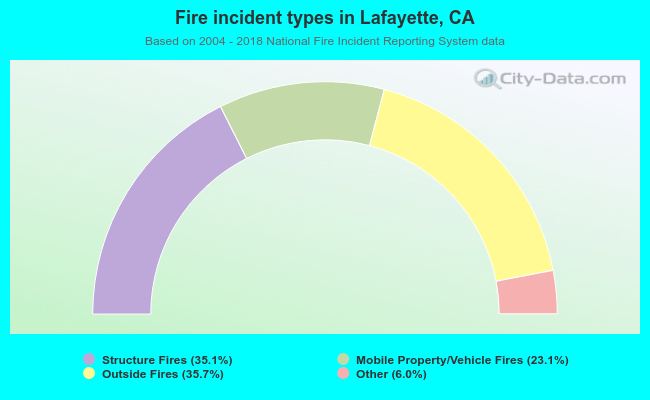 When looking into fire subcategories, the most reports belonged to: Outside Fires (35.7%), and Structure Fires (35.1%).