Lake Oswego: Fire Incidents, Oregon (OR)
Where are fire incidents reported in Lake Oswego, OR
Something went wrong! Please refresh the page.
| Fire incidents reported | |
|---|---|
| Sreet name | Count |
| BOONES FERRY RD | 110 |
| MEADOWS RD | 80 |
| JEAN RD | 76 |
| JEFFERSON PKY | 68 |
| COUNTRY CLUB RD | 62 |
| KRUSE WAY | 58 |
| STATE ST | 56 |
| CARMAN DR | 54 |
| OVERLOOK DR | 50 |
| 1ST ST | 46 |
| CHILDS RD | 44 |
| PILKINGTON RD | 42 |
| A AVE | 32 |
| BANGY RD | 32 |
| LAKEVIEW BLVD | 32 |
| B AVE | 30 |
| MCEWAN RD | 30 |
| PARKVIEW DR | 30 |
| BRYANT RD | 28 |
| GREENRIDGE DR | 28 |
| MCVEY AVE | 28 |
| 6TH ST | 26 |
| OSWEGO POINTE DR | 26 |
| BONITA RD | 24 |
| MT JEFFERSON TER | 24 |
| CENTERPOINTE DR | 22 |
| MONROE PKY | 22 |
| 2ND ST | 20 |
| C AVE | 20 |
| FOOTHILLS RD | 20 |
| Other | 307 |
2002 - 2018 National Fire Incident Reporting System (NFIRS) incidents
- Incident types reported to NFIRS in Lake Oswego, OR
- 4,99848.9%Rescue & EMS
- 1,52714.9%Fire
- 1,07310.5%Good Intent Call
- 9349.1%Service Call
- 8968.8%Hazardous Condition
- 6226.1%False Alarm
- 1551.5%Severe Weather
- 210.2%Overpressure Rupture
- Fire incident types reported to NFIRS in Lake Oswego, OR
- 77150.5%Outside Fires
- 60039.3%Structure Fires
- 1278.3%Mobile Property/Vehicle Fires
- 291.9%Other
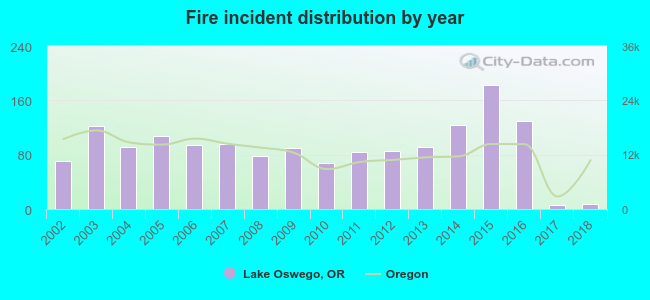 According to the data from the years 2002 - 2018 the average number of fires per year is 90. The highest number of reported fire incidents - 183 took place in 2015, and the least - 6 in 2017. The data has a declining trend.
The average number of yearly fire incidents per 10k residents in Lake Oswego, OR compared to nearest cities:
(Note: Based on data for the last 3 years, including only cities with population 5,000 and above)
| Lake Oswego: | 12.6 |
| Oak Grove: | 1.6 |
| Tigard: | 12.3 |
| Milwaukie: | 31.5 |
| West Linn: | 8.0 |
| Tualatin: | 14.5 |
| Gladstone: | 27.8 |
| Oregon City: | 20.3 |
| Clackamas: | 79.2 |
 The median response time based on all reported fire incidents is 6 minutes. This is close to the state median value.
The median response time in Lake Oswego, OR compared to nearest cities:
(Note: Based on data for all years, including only cities with at least 500 fire incidents)
| Lake Oswego: | 6 minutes |
| Tigard: | 6 minutes |
| Milwaukie: | 5 minutes |
| West Linn: | 7 minutes |
| Tualatin: | 6 minutes |
| Gladstone: | 5 minutes |
| Oregon City: | 6 minutes |
| Clackamas: | 6 minutes |
| Beaverton: | 6 minutes |
 According to the reports from the years 2002 - 2018 the average number of fire-related yearly deaths is 0. The highest number of deaths - 1 took place in 2004, and the lowest - 0 in 2002. The data has a constant trend.
 Based on the reports from the years 2002 - 2018 the average number of fire-related yearly casualties is 1. The highest number of reported casualties - 4 took place in 2002, and the lowest - 0 in 2009. The data has a declining trend.
The average number of injuries per 1,000 fire incidents is 13. This indicator was the highest - 57 in 2002, and the lowest 0 in 2009. The trend for casualties per 1,000 incidents is decreasing. Compared to the Oregon value the number of injuries per 1,000 incidents is about the same.
Based on the reports from the years 2002 - 2018 the average number of fire-related yearly casualties is 1. The highest number of reported casualties - 4 took place in 2002, and the lowest - 0 in 2009. The data has a declining trend.
The average number of injuries per 1,000 fire incidents is 13. This indicator was the highest - 57 in 2002, and the lowest 0 in 2009. The trend for casualties per 1,000 incidents is decreasing. Compared to the Oregon value the number of injuries per 1,000 incidents is about the same.
 33.7% incidents where reported in the morning and 66.3% in the evening. The most fires (15.5%) took place on Saturday, and the least (13.3%) on Wednesday.
 Based on the 1,527 fires from years 2002 - 2018 most fires (19.1%) took place during July, and the least (3.7%) in February.
 Out of all 10,229 cases reported during the years 2002 - 2018, the most belonged to the categories: Rescue & EMS (48.9%), Fire (14.9%), and Good Intent Call (10.5%).
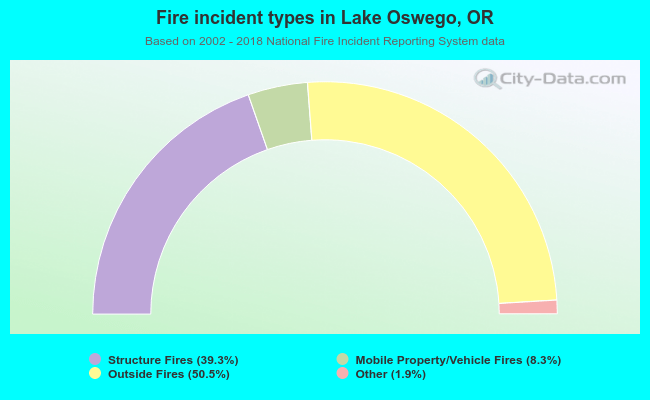 When looking into fire subcategories, the most reports belonged to: Outside Fires (50.5%), and Structure Fires (39.3%).