Lakefield: Fire Incidents, Minnesota (MN)
Where are fire incidents reported in Lakefield, MN
Something went wrong! Please refresh the page.
|
| |||||||||||||||||||||||||||||||||||||||||||||||||||||||||||||||||||||||||||||||||||||||||||||||||||||||||||||
| Other | 88 | |||||||||||||||||||||||||||||||||||||||||||||||||||||||||||||||||||||||||||||||||||||||||||||||||||||||||||||
2002 - 2018 National Fire Incident Reporting System (NFIRS) incidents
- Incident types reported to NFIRS in Lakefield, MN
- 21660.0%Fire
- 6718.6%Rescue & EMS
- 339.2%Hazardous Condition
- 185.0%Good Intent Call
- 174.7%False Alarm
- 41.1%Overpressure Rupture
- 41.1%Service Call
- 10.3%Special Incident
- Fire incident types reported to NFIRS in Lakefield, MN
- 9845.4%Outside Fires
- 6027.8%Structure Fires
- 4621.3%Mobile Property/Vehicle Fires
- 125.6%Other
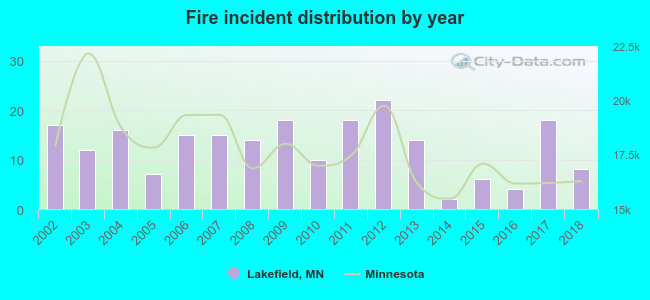 According to the data from the years 2002 - 2018 the average number of fire incidents per year is 13. The highest number of reported fires - 22 took place in 2012, and the least - 2 in 2014. The data has a dropping trend.
 Based on the data from the years 2002 - 2018 the average number of fire-related yearly deaths is 0. The highest number of reported deaths - 2 took place in 2007, and the lowest - 0 in 2003. The data has a dropping trend.
 30.1% incidents where reported in the morning and 69.9% in the evening. The most fires (21.3%) took place on Saturday, and the least (8.8%) on Friday.
 According to the 216 reports from years 2002 - 2018 most fires (16.7%) took place during November, and the least (2.8%) in February.
 Out of all 360 cases reported during the years 2002 - 2018, the most belonged to the categories: Fire (60.0%), Rescue & EMS (18.6%), and Hazardous Condition (9.2%).
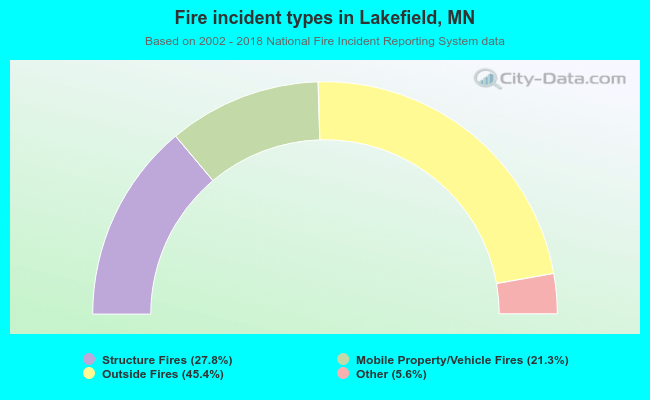 When looking into fire subcategories, the most incidents belonged to: Outside Fires (45.4%), and Structure Fires (27.8%).