Lakeland: Fire Incidents, Tennessee (TN)
Where are fire incidents reported in Lakeland, TN
Something went wrong! Please refresh the page.
|
| |||||||||||||||||||||||||||||||||||||||||||||||||||||||||||||||||||||||||||||||||||||||||||||||||||||||||||||
2004 - 2018 National Fire Incident Reporting System (NFIRS) incidents
- Incident types reported to NFIRS in Lakeland, TN
- 72043.9%Rescue & EMS
- 41725.4%Good Intent Call
- 19912.1%Fire
- 1519.2%Service Call
- 1116.8%False Alarm
- 382.3%Hazardous Condition
- 30.2%Overpressure Rupture
- 20.1%Severe Weather
- Fire incident types reported to NFIRS in Lakeland, TN
- 9849.2%Structure Fires
- 8040.2%Outside Fires
- 2110.6%Mobile Property/Vehicle Fires
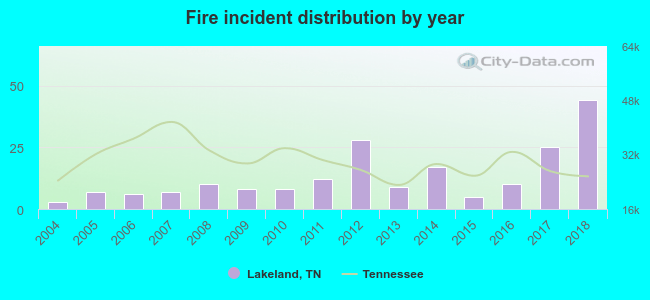 Based on the data from the years 2004 - 2018 the average number of fire incidents per year is 13. The highest number of reported fires - 44 took place in 2018, and the least - 3 in 2004. The data has a growing trend.
The average number of yearly fire incidents per 10k residents in Lakeland, TN compared to nearest cities:
(Note: Based on data for the last 3 years, including only cities with population 5,000 and above)
| Lakeland: | 21.0 |
| Arlington: | 86.2 |
| Bartlett: | 19.2 |
| Germantown: | 22.6 |
| Millington: | 173.9 |
| Oakland: | 92.0 |
| Collierville: | 23.1 |
| Atoka: | 78.0 |
| Munford: | 50.1 |

 28.6% incidents where reported in the morning and 71.4% in the evening. The most fires (19.6%) took place on Sunday, and the least (10.6%) on Monday.
 Based on the 199 fire incident reports from years 2004 - 2018 most fires (12.6%) took place during December, and the least (4.0%) in May.
 Out of all 1,641 cases reported during the years 2004 - 2018, the most belonged to the categories: Rescue & EMS (43.9%), Good Intent Call (25.4%), and Fire (12.1%).
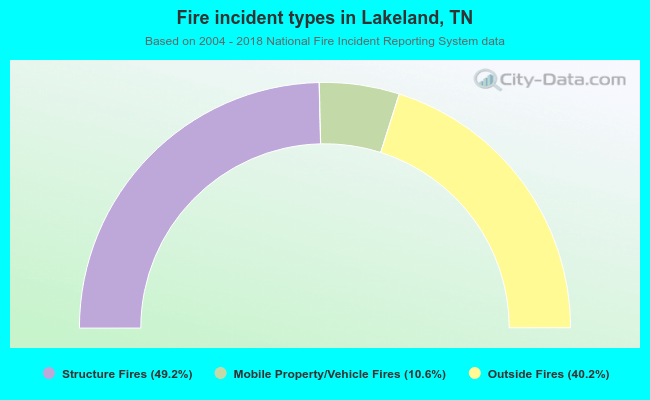 When looking into fire subcategories, the most incidents belonged to: Structure Fires (49.2%), and Outside Fires (40.2%).