| Fire incidents reported |
|---|
| Sreet name | Count |
|---|
| NASHVILLE HWY | 40 | | MORGAN COUNTY HWY | 20 | | SHADY GROVE RD | 16 | | LANDRUM HILL RD | 12 | | MONTGOMERY RD | 12 | | NASHVILLE HWY | 12 | | HAWN ROAD | 8 | | POTTERS CHAPEL ROAD | 8 | | CHARLIE NEWBERRY RD | 6 | | GENESIS RD | 6 | | GOBEY RD | 6 | | LILLY LN | 6 | | MORGAN CO HWY | 6 | | MORGAN COUNTY HWY | 6 | | RIDGE RD | 6 | | 2114 NASHVILLE HWY | 4 | | 2282 GENESIS RD. | 4 | | 2282 GENESIS ROAD | 4 | | 3054 NASHVILLE HWY. | 4 | | 312 LINDSEY HOWARD RD | 4 | | 857 GENESIS ROAD | 4 | | ANNADALE CEMETARY RD | 4 | | ANNADELL RD | 4 | | BARNETT BRIDGE ROAD | 4 | | GERALD BONHAM RD | 4 |
| | | Fire incidents reported |
|---|
| Sreet name | Count |
|---|
| GRANDVILLE HOWARD RD | 4 | | GRIFFITH RD | 4 | | JAMES BEASLEY RD | 4 | | OLD GOBEY RD | 4 | | POTTERS CHAPEL RD | 4 | | POTTERS CHAPEL RD. | 4 | | SCUTCHEON RD | 4 | | SPRING ST | 4 | | 1 MILE DOWN PINE FLATS ROAD | 2 | | 109 STRINGFIELD RD | 2 | | 1117 BARNETT BRIDGE ROAD | 2 | | 1157 GENESIS RD | 2 | | 1186 GENESIS RD | 2 | | 122 GEORGE POTTER RD | 2 | | 1227 GENESIS ROAD | 2 | | 1237 GENESIS RD | 2 | | 1237 GENEIS RD | 2 | | 1237 GENESIS RD | 2 | | 128 NELSON RD. | 2 | | 130 MONTGOMERY RD | 2 | | 131 LILLY LN | 2 | | 132 NELSON RD | 2 | | 132 T. COOPER RD | 2 | | 138 HUSE POTTER RD. | 2 | | |
|
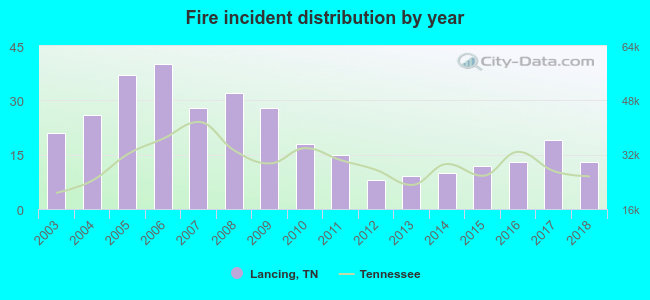 Based on the data from the years 2003 - 2018 the average number of fire incidents per year is 21. The highest number of reported fires - 40 took place in 2006, and the least - 8 in 2012. The data has a dropping trend.
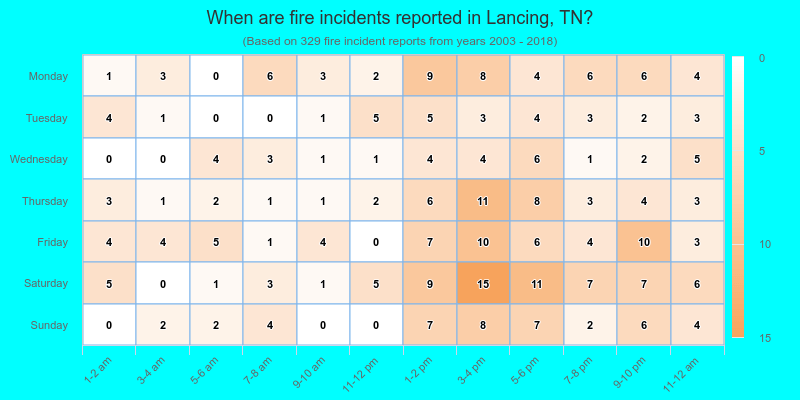
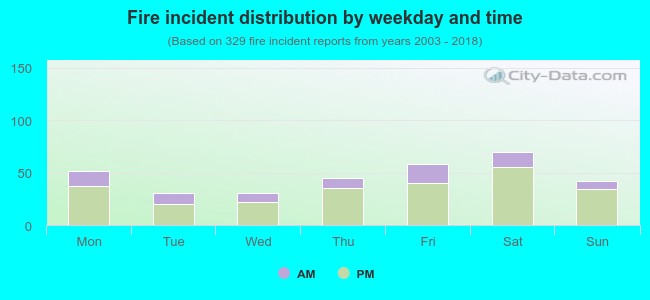 26.1% incidents where reported in the morning and 73.9% in the evening. The most fires (21.3%) took place on Saturday, and the least (9.4%) on Tuesday.
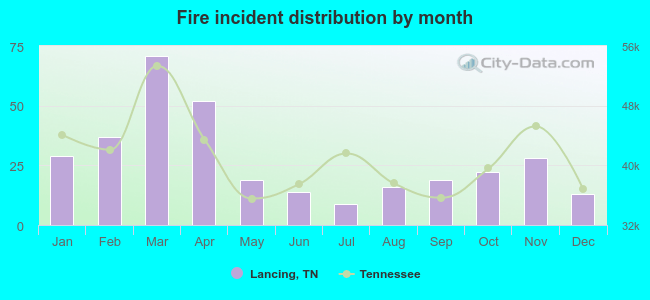 Based on the 329 fire incident reports from years 2003 - 2018 most fires (21.6%) took place during March, and the least (2.7%) in July.
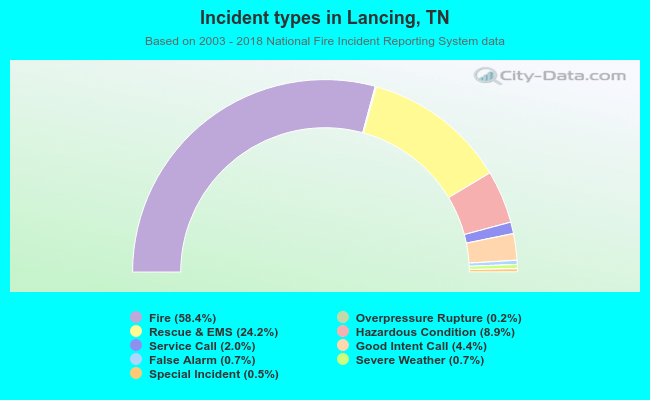 Out of all 563 cases reported during the years 2003 - 2018, the most belonged to the categories: Fire (58.4%), Rescue & EMS (24.2%), and Hazardous Condition (8.9%).
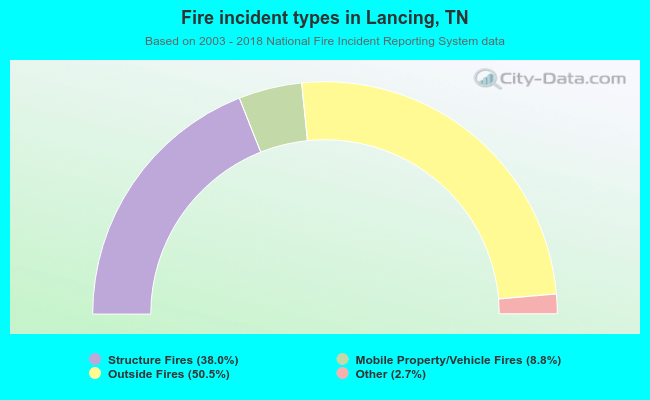 When looking into fire subcategories, the most incidents belonged to: Outside Fires (50.5%), and Structure Fires (38.0%).