| Fire incidents reported |
|---|
| Sreet name | Count |
|---|
| CORYDON RIDGE RD | 32 | | I-64 EASTBOUND | 28 | | CRANDALL - LANESVILLE RD | 20 | | STATE ROAD 62 | 20 | | I-64 WESTBOUND | 16 | | HEINZE RD | 14 | | HIGHWAY 11 HWY | 12 | | SCENIC DRIVE DR | 12 | | ST. JOHNS CHURCH RD | 12 | | BALL DIAMOND HILL RD | 10 | | LAZY CREEK RD | 8 | | MAIN ST | 8 | | PENNINGTON ST | 8 | | STATE ROAD 11 | 8 | | BIG INDIAN RD | 6 | | I64 EASTBOUND | 6 | | I64 WESTBOUND | 6 | | KENSINGTON RD | 6 | | OLD LANESVILLE RD | 6 | | SMITH CREEK RD | 6 | | ST PETER'S CHURCH RD | 6 | | WISMANN RD | 6 | | COREY DR | 4 | | CRESTVIEW AVE | 4 | | GEORGE'S HILL RD | 4 |
| | | Fire incidents reported |
|---|
| Sreet name | Count |
|---|
| GLEITZ BLANK RD | 4 | | HIGH RIDGE LANE | 4 | | HIGHWAY 11 | 4 | | LANESVILLE RD | 4 | | NEW MIDDLETOWN RD | 4 | | PFRIMMER'S CHAPEL RD | 4 | | PONDEROSA RD | 4 | | RACOON CREEK RD | 4 | | ST JOHN'S CHURCH RD | 4 | | ST JOHNS CHURCH RD | 4 | | STATE RD 11 | 4 | | STATE ROAD 62 RD | 4 | | TANDY RD | 4 | | TURLEY RD | 4 | | WHISPERING VALLEY RD | 4 | | WOODY LANE | 4 | | 114 MM EXPY | 2 | | ANGLE RUN RD | 2 | | BARON AVE | 2 | | BLUNK KNOB RD | 2 | | BRECKENRIDGE RD | 2 | | BROADUS RD | 2 | | BUCK CREEK RIDGE RD | 2 | | CEDAR POINT | 2 | | |
|
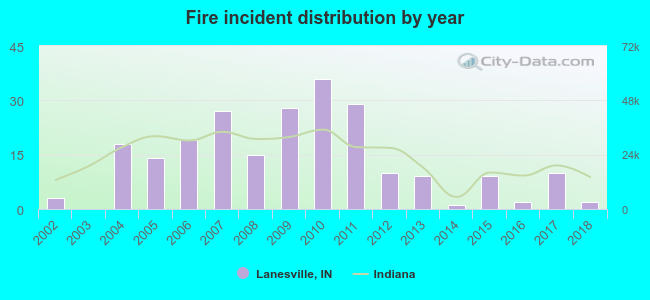 According to the data from the years 2002 - 2018 the average number of fire incidents per year is 14. The highest number of fire incidents - 36 took place in 2010, and the least - 0 in 2003. The data has a declining trend.
 26.7% incidents where reported in the morning and 73.3% in the evening. The most fires (19.0%) took place on Saturday, and the least (9.9%) on Thursday.
 According to the 232 fire incident reports from years 2002 - 2018 most fires (15.5%) took place during March, and the least (3.4%) in December.
 Out of all 422 cases reported during the years 2002 - 2018, the most belonged to the categories: Fire (55.0%), Rescue & EMS (22.3%), and Service Call (11.1%).
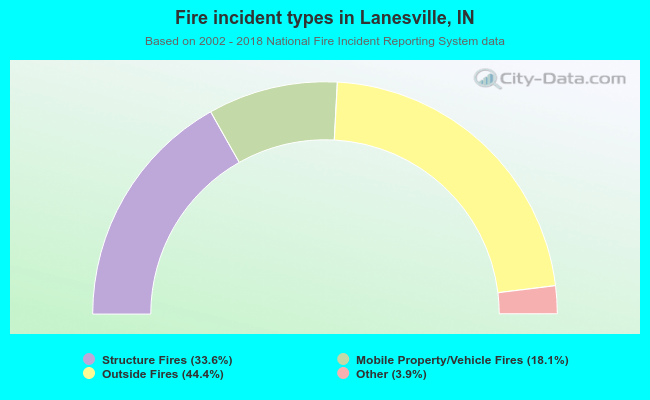 When looking into fire subcategories, the most reports belonged to: Outside Fires (44.4%), and Structure Fires (33.6%).