Langhorne: Fire Incidents, Pennsylvania (PA)
Where are fire incidents reported in Langhorne, PA
Something went wrong! Please refresh the page.
|
| |||||||||||||||||||||||||||||||||||||||||||||||||||||||||||||||||||||||||||||||||||||||||||||||||||||||||||||
| Other | 23 | |||||||||||||||||||||||||||||||||||||||||||||||||||||||||||||||||||||||||||||||||||||||||||||||||||||||||||||
2003 - 2018 National Fire Incident Reporting System (NFIRS) incidents
- Incident types reported to NFIRS in Langhorne, PA
- 1,13525.4%Fire
- 94821.3%Good Intent Call
- 94021.1%Hazardous Condition
- 74216.6%False Alarm
- 59213.3%Rescue & EMS
- 932.1%Service Call
- 50.1%Overpressure Rupture
- Fire incident types reported to NFIRS in Langhorne, PA
- 57850.9%Structure Fires
- 34430.3%Outside Fires
- 18716.5%Mobile Property/Vehicle Fires
- 262.3%Other
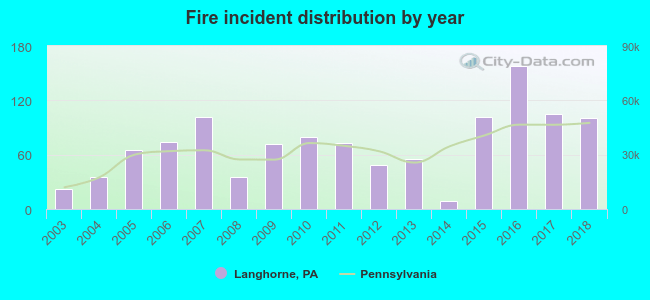 According to the data from the years 2003 - 2018 the average number of fires per year is 71. The highest number of fire incidents - 158 took place in 2016, and the least - 9 in 2014. The data has a growing trend.
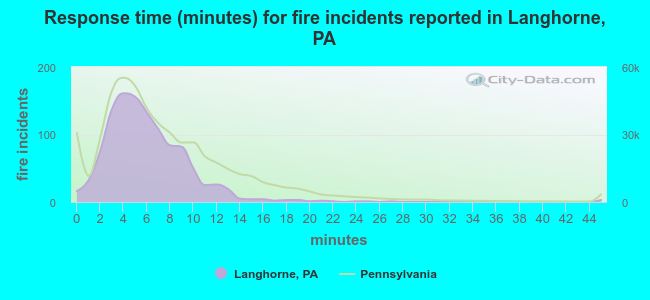 The median response time based on all reported fire incidents is 5 minutes. This is lower than the state median value.
The median response time in Langhorne, PA compared to nearest cities:
(Note: Based on data for all years, including only cities with at least 500 fire incidents)
| Langhorne: | 5 minutes |
| Levittown: | 5 minutes |
| Croydon: | 4 minutes |
| Bristol: | 5 minutes |
| Florence: | 8 minutes |
| Morrisville: | 6 minutes |
| Ewing: | 6 minutes |
| Trenton: | 4 minutes |
| Bordentown: | 7 minutes |
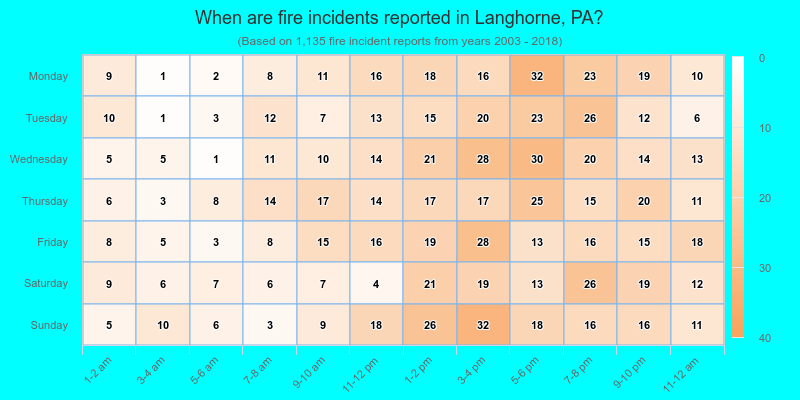
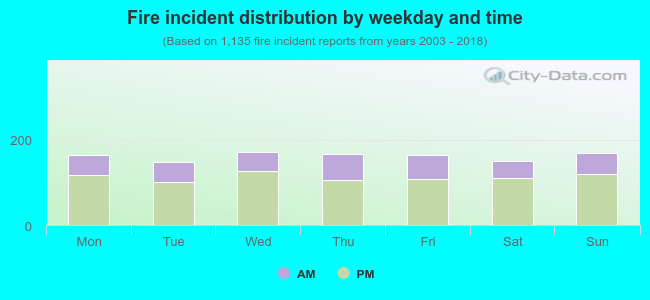 30.5% incidents where reported in the morning and 69.5% in the evening. The most fires (15.2%) took place on Wednesday, and the least (13.0%) on Tuesday.
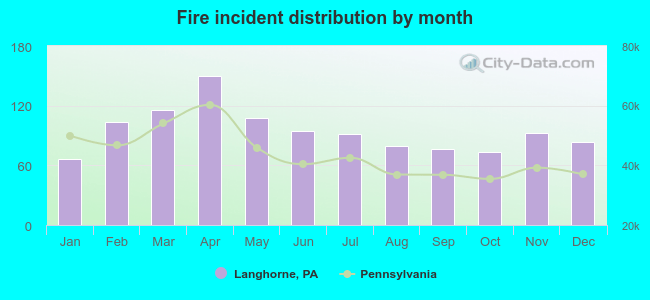 Based on the 1,135 fires from years 2003 - 2018 most fires (13.2%) took place during April, and the least (5.8%) in January.
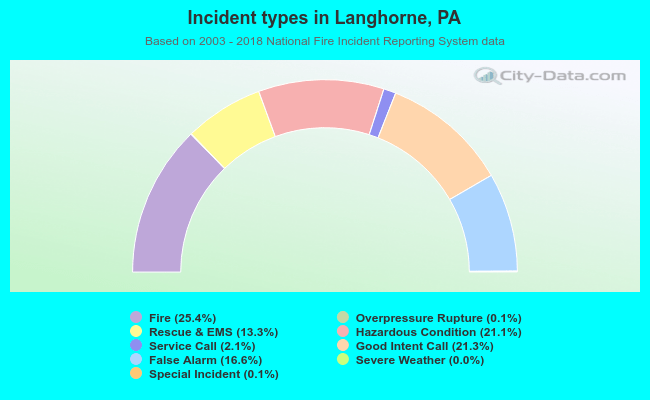 Out of all 4,460 cases reported during the years 2003 - 2018, the most belonged to the categories: Fire (25.4%), Good Intent Call (21.3%), and Hazardous Condition (21.1%).
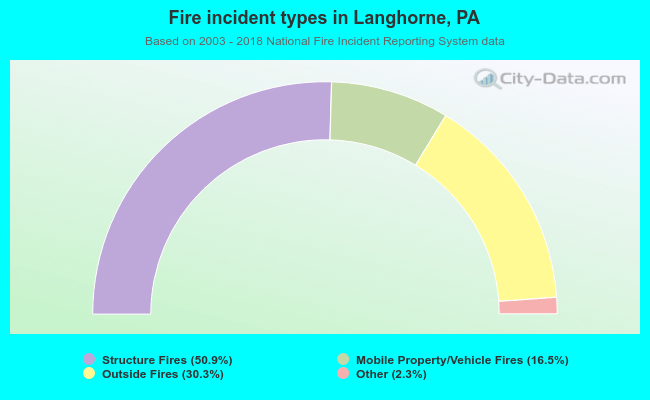 When looking into fire subcategories, the most incidents belonged to: Structure Fires (50.9%), and Outside Fires (30.3%).