| Fire incidents reported |
|---|
| Sreet name | Count |
|---|
| NORTH 71 | 66 | | MOCCASIN VALLEY RD | 36 | | MOCCASIN | 24 | | HANSONVILLE | 14 | | MOCCASIN RD | 12 | | MOCCASIN VALLEY RD. | 12 | | CROSS ROADS | 10 | | MOCCASIN VALLEY ROAD | 10 | | MOCCASIN VALLY RD. | 8 | | RT 613 | 8 | | TOWER RD | 8 | | 0 THOMAS WARNER RD | 6 | | CLINCH MT. RD. | 6 | | MOCCASIN VALLY RD | 6 | | MORNING STAR CIRCLE | 6 | | RT613 | 6 | | US HIGHWAY 19 | 6 | | 613 | 4 | | 71 | 4 | | CROSSROADS | 4 | | DODGE STREET | 4 | | FORK RIDGE | 4 | | MAIN STREET | 4 | | MOCCASIN ROAD | 4 | | N71 | 4 |
| | | Fire incidents reported |
|---|
| Sreet name | Count |
|---|
| OLD FINCASTLE RD | 4 | | RIVER MOUNTAIN ROAD | 4 | | RT 19 | 4 | | RT 58 | 4 | | RT19 | 4 | | RT58 | 4 | | U.S. HIGHWAY 19 | 4 | | 1071 FORK RIDGE RD | 2 | | 1203 STONEBRUISE RD | 2 | | 4683 MOCASSIN VALLEY ROAD | 2 | | 614 | 2 | | 671 | 2 | | 71 HWY | 2 | | BARTON DRIVE | 2 | | BOOKER ROAD | 2 | | BUSINESS RT. 19 | 2 | | CARTERTON RD. | 2 | | CEDAR CREED DRIVE | 2 | | CEDAR CREEK ROAD | 2 | | CEDAR CREEK ROAD RD | 2 | | CEDAR ROCK MOBIL HOME PARK | 2 | | CHURCH HILL RD | 2 | | CLENCH MT. ROAD | 2 | | CLIFFSIDE DRIVE | 2 | | CLINCH MOUNT RD | 2 |
|
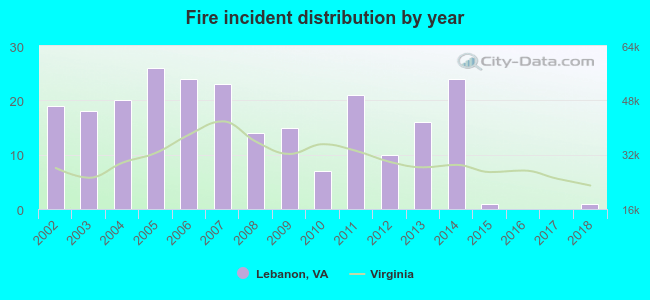 Based on the data from the years 2002 - 2018 the average number of fire incidents per year is 14. The highest number of reported fires - 26 took place in 2005, and the least - 0 in 2016. The data has a dropping trend.
 30.5% incidents where reported in the morning and 69.5% in the evening. The most fires (23.8%) took place on Sunday, and the least (9.2%) on Wednesday.
 Based on the 239 reports from years 2002 - 2018 most fires (14.2%) took place during April, and the least (4.2%) in August.
 Out of all 495 cases reported during the years 2002 - 2018, the most belonged to the categories: Fire (48.3%), Hazardous Condition (32.5%), and Good Intent Call (7.7%).
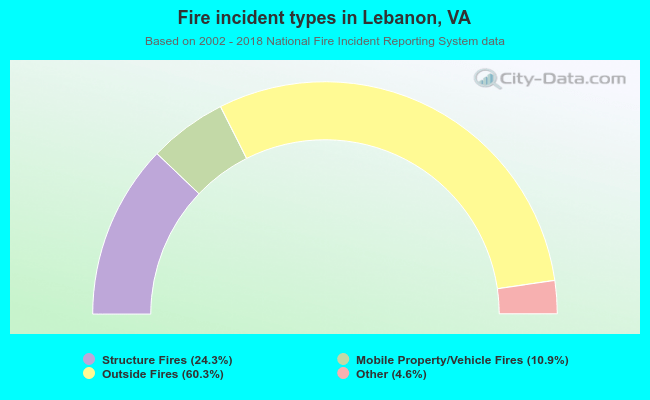 When looking into fire subcategories, the most incidents belonged to: Outside Fires (60.3%), and Structure Fires (24.3%).