| Fire incidents reported |
|---|
| Sreet name | Count |
|---|
| 220 MAIN ST ST | 6 | | 4426 HWY 50 HWY | 6 | | 100 LITTLE CREEK RD RD | 4 | | 1008 LITTLE CREEK RD RD | 4 | | 1095 METHODIST CHURCH RD RD | 4 | | 1129 EBENEZER RD RD | 4 | | 1671 HORTON RD RD | 4 | | 1839 EBENEZER RD RD | 4 | | 3785 HWY C HWY | 4 | | 3800 OLD STATE RD RD | 4 | | 4426 HWY-50 HWY | 4 | | 50 HWY | 4 | | 5103 NOSER MILL RD RD | 4 | | 55 POST OAK RD RD | 4 | | 600 JAUDON RD RD | 4 | | 6110 HWY-AC HWY | 4 | | 7150 HWY-185 RD | 4 | | 8471 HWY 185 HWY | 4 | | 8941 HWY YY HWY | 4 | | 900 FARRAR LN LN | 4 | | FARRAR LN | 4 | | LAKE DR | 4 | | 95 NORTH LAKE DR DR | 2 | | #20 EAST AVE AVE | 2 | | #43 LITTLE CREEK RD RD | 2 |
| | | Fire incidents reported |
|---|
| Sreet name | Count |
|---|
| #53 CENTRY OAKS | 2 | | #68 POST OAK RD RD | 2 | | #85 N. LAKE DR RD | 2 | | #98 POST OAK RD RD | 2 | | 100 FLINT HILL RD RD | 2 | | 1059 NORTH FLINHILL RD RD | 2 | | 1059 NORTH FLINTHILL RD RD | 2 | | 1081 LITTLE CREEK RD RD | 2 | | 1083 LITTLE CREEK RD RD | 2 | | 11 MELODY DR RD | 2 | | 111 N. MELODY DR RD | 2 | | 1144 LITTLE CREEK RD RD | 2 | | 1240 EBENEZER RD RD | 2 | | 125 HUNTERS PATH RD | 2 | | 1266 WEST CASCO RD RD | 2 | | 133 TOELKE LN | 2 | | 1335 DIERKING RD RD | 2 | | 1398 EBENEZER RD RD | 2 | | 1433 EBENEZER RD RD | 2 | | 1475 EBENEZER RD RD | 2 | | 1496 N. FLINT HILL RD RD | 2 | | 1530 EBENEZER RD RD | 2 | | 1531 N. FLINT HILL RD RD | 2 | | 1629 HORTON RD. RD | 2 | | |
|
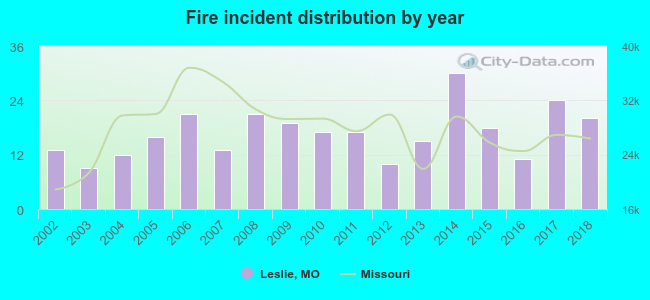 According to the data from the years 2002 - 2018 the average number of fires per year is 17. The highest number of fire incidents - 30 took place in 2014, and the least - 9 in 2003. The data has an increasing trend.
 According to the data from the years 2002 - 2018 the average number of fire-related casualties per year is 0. The highest number of injuries - 2 took place in 2010, and the lowest - 0 in 2002. The data has a constant trend.
 24.8% incidents where reported in the morning and 75.2% in the evening. The most fires (19.6%) took place on Sunday, and the least (9.8%) on Tuesday.
 According to the 286 incident reports from years 2002 - 2018 most fires (20.3%) took place during March, and the least (2.1%) in September.
 Out of all 852 cases reported during the years 2002 - 2018, the most belonged to the categories: Rescue & EMS (40.8%), Fire (33.6%), and Good Intent Call (9.4%).
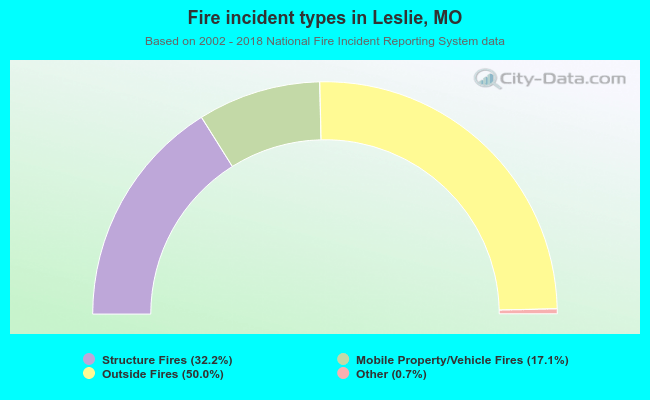 When looking into fire subcategories, the most reports belonged to: Outside Fires (50.0%), and Structure Fires (32.2%).