Lincoln: Fire Incidents, Rhode Island (RI)
Where are fire incidents reported in Lincoln, RI
Something went wrong! Please refresh the page.
| Fire incidents reported | |
|---|---|
| Sreet name | Count |
| GEORGE WASHINGTON HWY | 96 |
| FRANKLIN ST | 54 |
| WAKE ROBIN RD | 52 |
| GREAT RD | 44 |
| SMITHFIELD AVE | 44 |
| LONSDALE AVE | 42 |
| TWIN RIVERLIME ROCK RD | 40 |
| OLD RIVER RD | 32 |
| FRONT ST | 28 |
| BREAKNECK HILL RD | 26 |
| INDUSTRIAL CIR | 26 |
| RT 146 NORTHBOUNDLRFD HWY | 26 |
| WELLINGTON RD | 26 |
| CROW POINT RD | 24 |
| JOHN ST | 24 |
| OLD LOUISQUISSET PIKE | 24 |
| JENCKES HILL RD | 22 |
| RIVER RD | 22 |
| RT 146 | 22 |
| HARRIS AVE | 20 |
| MOSHASSUCK VALLEY INDUSTR HWY | 20 |
| OLD LOUSQUISETT PIKE | 20 |
| TWIN RIVER RD | 20 |
| BLACKSTONE VALLEY PL | 18 |
| CHAPEL ST | 18 |
| OLD LOUISQUISSETLR PIKE | 18 |
| TWIN RIVER (LIME ROCK) RD | 18 |
| UNION ST | 18 |
| ANGELL (LIME ROCK) RD | 16 |
| LONSDALE MAIN ST | 16 |
| Other | 118 |
2003 - 2018 National Fire Incident Reporting System (NFIRS) incidents
- Incident types reported to NFIRS in Lincoln, RI
- 5,15452.1%Rescue & EMS
- 1,36313.8%False Alarm
- 99410.1%Fire
- 7978.1%Good Intent Call
- 7187.3%Service Call
- 6636.7%Hazardous Condition
- 1871.9%Overpressure Rupture
- 100.1%Special Incident
- Fire incident types reported to NFIRS in Lincoln, RI
- 62162.5%Structure Fires
- 21121.2%Outside Fires
- 11711.8%Mobile Property/Vehicle Fires
- 454.5%Other
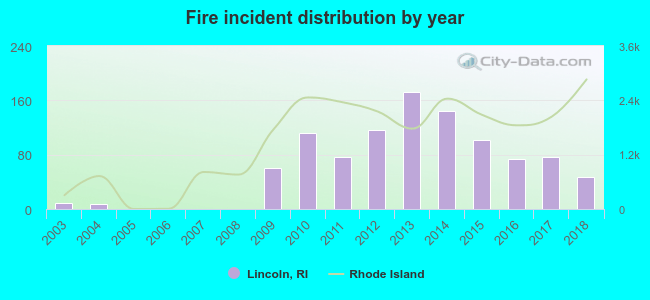 According to the data from the years 2003 - 2018 the average number of fire incidents per year is 62. The highest number of fires - 172 took place in 2013, and the least - 0 in 2005. The data has a growing trend.
The average number of yearly fire incidents per 10k residents in Lincoln, RI compared to nearest cities:
(Note: Based on data for the last 3 years, including only cities with population 5,000 and above)
| Lincoln: | 31.0 |
| Cumberland: | 39.7 |
| Central Falls: | 96.2 |
| Pawtucket: | 0.3 |
| Smithfield: | 27.7 |
| Woonsocket: | 50.6 |
| Providence: | 4.8 |
| Johnston: | 26.6 |
| North Smithfield: | 12.0 |
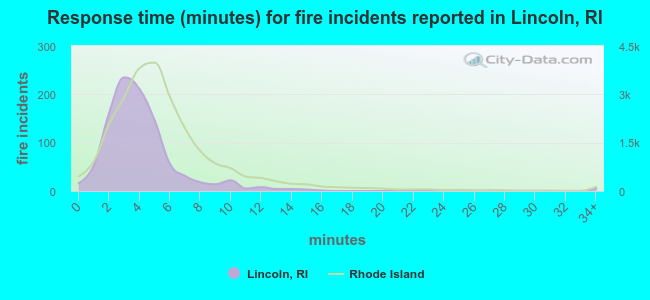 The median response time based on all reported fire incidents is 4 minutes. This is lower than the Rhode Island median value.
The median response time in Lincoln, RI compared to nearest cities:
(Note: Based on data for all years, including only cities with at least 500 fire incidents)
| Lincoln: | 4 minutes |
| Cumberland: | 6 minutes |
| Central Falls: | 2 minutes |
| North Providence: | 4 minutes |
| Smithfield: | 6 minutes |
| Attleboro: | 4 minutes |
| Woonsocket: | 5 minutes |
| Providence: | 5 minutes |
| Seekonk: | 6 minutes |
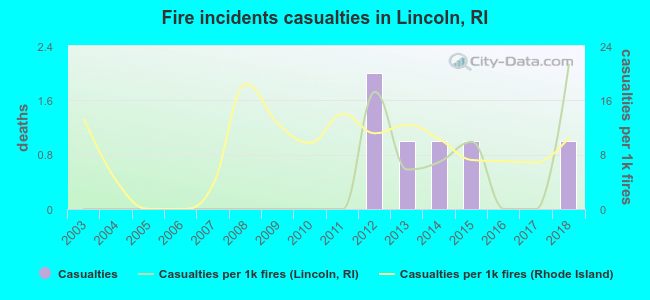 Based on the data from the years 2003 - 2018 the average number of fire-related yearly casualties is 0. The highest number of reported injuries - 2 took place in 2012, and the lowest - 0 in 2003. The data has a rising trend.
The average number of injuries per 1,000 fire incidents is 4. This indicator was the highest - 21 in 2018, and the lowest 0 in 2003. The trend for casualties per 1,000 incidents is rising. Compared to the Rhode Island value the number of casualties per 1,000 incidents is lower.
Based on the data from the years 2003 - 2018 the average number of fire-related yearly casualties is 0. The highest number of reported injuries - 2 took place in 2012, and the lowest - 0 in 2003. The data has a rising trend.
The average number of injuries per 1,000 fire incidents is 4. This indicator was the highest - 21 in 2018, and the lowest 0 in 2003. The trend for casualties per 1,000 incidents is rising. Compared to the Rhode Island value the number of casualties per 1,000 incidents is lower.Casualties per 1,000 incidents in Lincoln, RI compared to nearest cities:
(Note: Based on data for all years, including only cities with at least 500 fire incidents)
| Lincoln: | 6.0 |
| Cumberland: | 7.6 |
| Central Falls: | 11.8 |
| North Providence: | 10.6 |
| Smithfield: | 6.1 |
| Attleboro: | 9.0 |
| Woonsocket: | 9.9 |
| Providence: | 0.7 |
| Seekonk: | 11.2 |
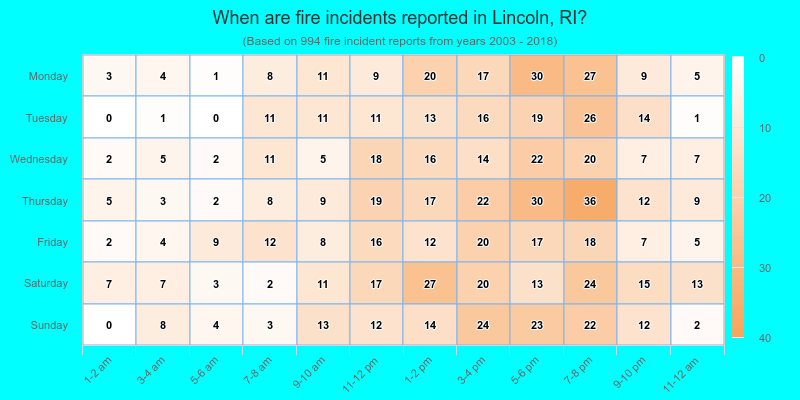
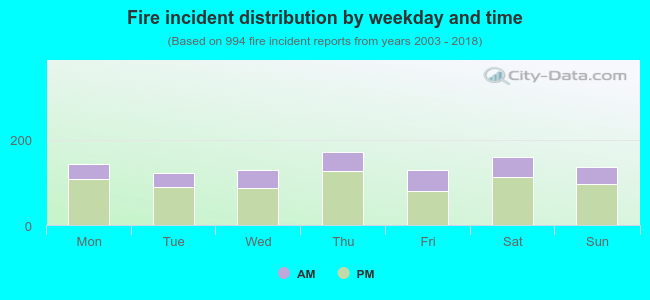 29.9% incidents where reported in the morning and 70.1% in the evening. The most fires (17.3%) took place on Thursday, and the least (12.4%) on Tuesday.
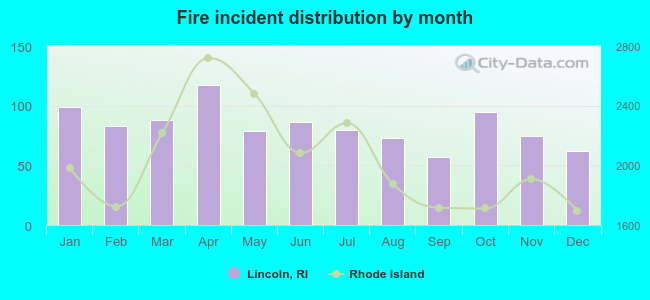 According to the 994 fire incident reports from years 2003 - 2018 most fires (11.8%) took place during April, and the least (5.7%) in September.
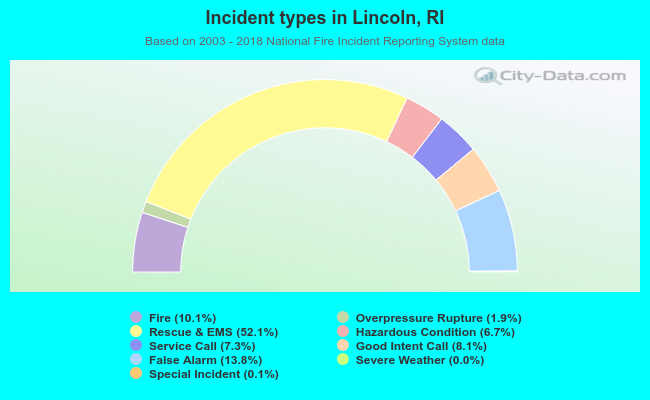 Out of all 9,890 cases reported during the years 2003 - 2018, the most belonged to the categories: Rescue & EMS (52.1%), False Alarm (13.8%), and Fire (10.1%).
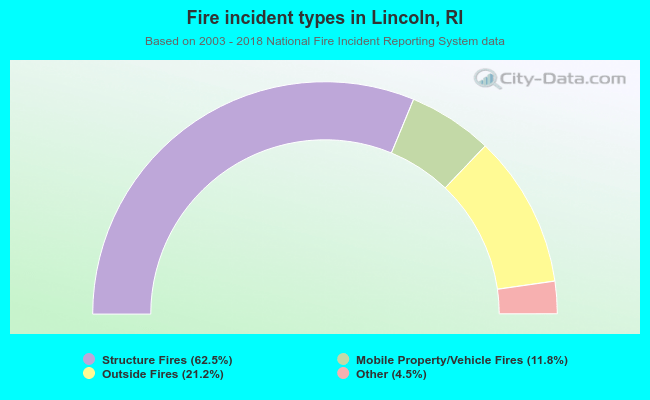 When looking into fire subcategories, the most incidents belonged to: Structure Fires (62.5%), and Outside Fires (21.2%).