| Fire incidents reported |
|---|
| Sreet name | Count |
|---|
| CEDAR CREEK ROAD | 14 | | HWY 412 | 14 | | HWY 412 WEST | 12 | | OLD HWY 13 | 10 | | 14270 HWY 438 WEST | 8 | | HWY 100 | 8 | | HWY 412 HWY | 8 | | 9759 HWY 412 WEST | 6 | | ALDRIDGE CIR | 6 | | CEDAR AVE | 6 | | CEDAR CREEK RD | 6 | | CEDAR CREEK ROAD RD | 6 | | CYPRESS CREEK RD | 6 | | HIGHWAY 128 HWY | 6 | | HWY 128 | 6 | | HWY 438 WEST | 6 | | LICK CREEK RD | 6 | | LOWER BRUSH CREEK RD | 6 | | ROCKHOUSE RD | 6 | | 131 LOBELVILLE HWY | 4 | | 1609 CYPRESS CREEK RD | 4 | | 208 GRAHAM DRIVE | 4 | | 314 HILL RD | 4 | | ARMSTRONG RD | 4 | | BIG OPPOSUM RD | 4 |
| | | Fire incidents reported |
|---|
| Sreet name | Count |
|---|
| BROOKLYN AVE | 4 | | BUCK FORK RD | 4 | | BUCK FORK RD | 4 | | BUCKFORK RD | 4 | | CYPRESS CREEK MARINA RD | 4 | | DEER CREEK ROAD RD | 4 | | HIGHWAY 412 WEST | 4 | | HIGHWAY 412 WEST HWY | 4 | | HILL ST | 4 | | HWY 412 | 4 | | HWY 438 WEST RD | 4 | | LICK CREEK RD | 4 | | LOBELVILLE HWY | 4 | | LOBELVILLE HWY | 4 | | LOWER LICK CREEK ROAD RD | 4 | | MAIN ST ST | 4 | | PERIWINKLE LN | 4 | | SLINK SHOALS SPUR RD | 4 | | SQUIRREL HOLLOW DR | 4 | | SUMAC ROAD RDS | 4 | | TREE FARM RD | 4 | | VAUGHN AVE | 4 | | WADE LANE | 4 | | 101 WEST MAIN STREET | 2 | | |
|
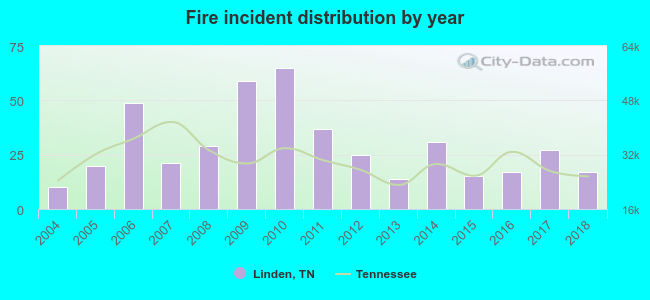 According to the data from the years 2004 - 2018 the average number of fires per year is 29. The highest number of fires - 65 took place in 2010, and the least - 10 in 2004. The data has a growing trend.
 Based on the reports from the years 2004 - 2018 the average number of fire-related yearly casualties is 0. The highest number of reported casualties - 1 took place in 2012, and the lowest - 0 in 2004. The data has a constant trend.
 28.9% incidents where reported in the morning and 71.1% in the evening. The most fires (20.9%) took place on Saturday, and the least (9.9%) on Tuesday.
 Based on the 436 incident reports from years 2004 - 2018 most fires (14.2%) took place during March, and the least (1.8%) in May.
 Out of all 552 cases reported during the years 2004 - 2018, the most belonged to the categories: Fire (79.0%), Overpressure Rupture (10.7%), and Service Call (2.7%).
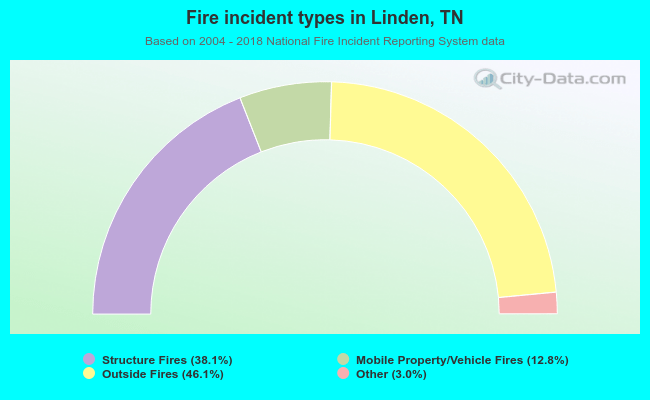 When looking into fire subcategories, the most incidents belonged to: Outside Fires (46.1%), and Structure Fires (38.1%).