Little Elm: Fire Incidents, Texas (TX)
Where are fire incidents reported in Little Elm, TX
Something went wrong! Please refresh the page.
| Fire incidents reported | |
|---|---|
| Sreet name | Count |
| ELDORADO PKY | 162 |
| FM 423 | 96 |
| PRESTON ON THE LAKE BLVD | 60 |
| UNIVERSITY DR | 60 |
| MISTY TRL | 56 |
| FM 720 | 54 |
| KING RD | 40 |
| TWO PINES LN | 38 |
| GARZA LN | 36 |
| SLEEPY HOLLOW TRL | 36 |
| WITT RD | 36 |
| CRESTWOOD PL | 30 |
| EDGEWOOD PL | 30 |
| SHADY TRL | 30 |
| NAVO RD | 28 |
| HWY 380 | 26 |
| MAIN ST | 24 |
| UNKNOWN | 24 |
| 380 HWY | 22 |
| BREANNA WAY | 22 |
| LOBO LN | 22 |
| SHADY LN | 22 |
| CRESTPOINT DR | 20 |
| DOE BRANCH | 20 |
| FRENCH SETTLEMENT RD | 20 |
| PARK DR | 20 |
| PORT SULLIVAN DR | 20 |
| WALKER LN | 20 |
| 423 FM | 18 |
| DICKSON LN | 18 |
| Other | 894 |
2002 - 2018 National Fire Incident Reporting System (NFIRS) incidents
- Incident types reported to NFIRS in Little Elm, TX
- 10,07052.4%Rescue & EMS
- 2,83614.8%Service Call
- 2,00410.4%Fire
- 1,9029.9%Good Intent Call
- 1,4007.3%False Alarm
- 9044.7%Hazardous Condition
- 520.3%Special Incident
- Fire incident types reported to NFIRS in Little Elm, TX
- 87243.5%Structure Fires
- 84142.0%Outside Fires
- 1547.7%Mobile Property/Vehicle Fires
- 1376.8%Other
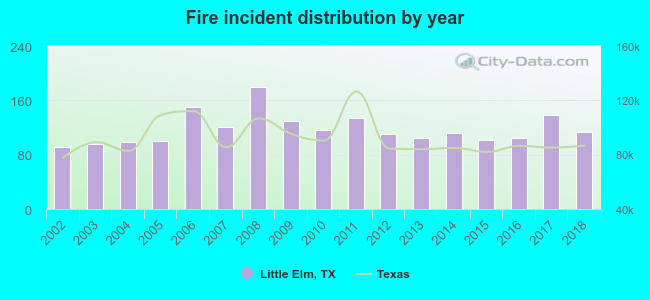 According to the data from the years 2002 - 2018 the average number of fire incidents per year is 118. The highest number of fires - 180 took place in 2008, and the least - 92 in 2002. The data has a growing trend.
The average number of yearly fire incidents per 10k residents in Little Elm, TX compared to nearest cities:
(Note: Based on data for the last 3 years, including only cities with population 5,000 and above)
| Little Elm: | 33.7 |
| Colony: | 0.2 |
| The Colony: | 16.8 |
| Lake Dallas: | 36.3 |
| Frisco: | 17.9 |
| Corinth: | 16.5 |
| Highland Village: | 24.0 |
| Prosper: | 41.9 |
| Lewisville: | 27.2 |
 The median response time based on all reported fire incidents is 7 minutes. This is similar to the Texas median value.
The median response time in Little Elm, TX compared to nearest cities:
(Note: Based on data for all years, including only cities with at least 500 fire incidents)
| Little Elm: | 7 minutes |
| The Colony: | 5 minutes |
| Frisco: | 5 minutes |
| Corinth: | 6 minutes |
| Highland Village: | 7 minutes |
| Prosper: | 6 minutes |
| Lewisville: | 5 minutes |
| Aubrey: | 9 minutes |
| Denton: | 6 minutes |
 According to the data from the years 2002 - 2018 the average number of fire-related casualties per year is 1. The highest number of casualties - 5 took place in 2014, and the lowest - 0 in 2002. The data has an increasing trend.
The average number of injuries per 1,000 fires is 10. This indicator was the highest - 45 in 2014, and the lowest 0 in 2002. The trend for casualties per 1,000 incidents is rising. Compared to the Texas value the number of casualties per 1,000 fires is higher.
According to the data from the years 2002 - 2018 the average number of fire-related casualties per year is 1. The highest number of casualties - 5 took place in 2014, and the lowest - 0 in 2002. The data has an increasing trend.
The average number of injuries per 1,000 fires is 10. This indicator was the highest - 45 in 2014, and the lowest 0 in 2002. The trend for casualties per 1,000 incidents is rising. Compared to the Texas value the number of casualties per 1,000 fires is higher.Casualties per 1,000 incidents in Little Elm, TX compared to nearest cities:
(Note: Based on data for all years, including only cities with at least 500 fire incidents)
| Little Elm: | 10.0 |
| The Colony: | 7.1 |
| Frisco: | 14.0 |
| Corinth: | 10.7 |
| Highland Village: | 0.0 |
| Prosper: | 1.3 |
| Lewisville: | 8.1 |
| Aubrey: | 1.9 |
| Denton: | 8.5 |
 27.9% incidents where reported in the morning and 72.1% in the evening. The most fires (16.1%) took place on Saturday, and the least (13.1%) on Thursday.
 Based on the 2,004 fires from years 2002 - 2018 most fires (10.9%) took place during August, and the least (5.9%) in November.
 Out of all 19,200 cases reported during the years 2002 - 2018, the most belonged to the categories: Rescue & EMS (52.4%), Service Call (14.8%), and Fire (10.4%).
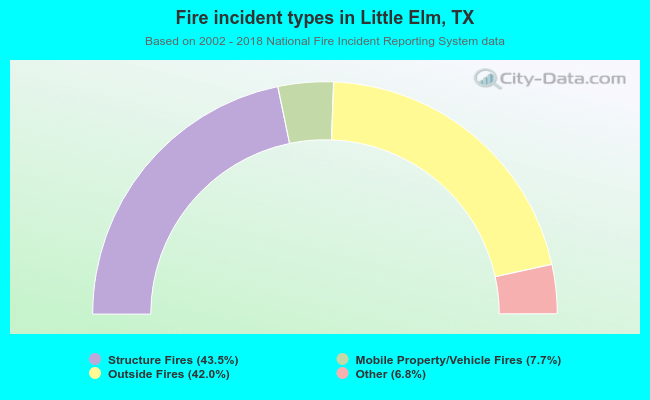 When looking into fire subcategories, the most reports belonged to: Structure Fires (43.5%), and Outside Fires (42.0%).