| Fire incidents reported |
|---|
| Sreet name | Count |
|---|
| 97 HWY | 8 | | 387 W DADE 102 ROAD | 6 | | 97 HIGH | 6 | | 1501 MAIN STR | 4 | | 405 LOCUST STR | 4 | | 409 CHESTNUT ROAD | 4 | | 430 W. DADE 112 ROAD | 4 | | 726 NO. DADE 81 ROAD | 4 | | 97 HWY ROAD | 4 | | 985 W DADE 56 ROAD | 4 | | YY HWY | 4 | | 1 1/4 HWY E HIGH | 2 | | 1/4 M ROAD | 2 | | 102 W DADE ROAD | 2 | | 103 W DADE 92 ROAD | 2 | | 105 LAWRENCE ROAD | 2 | | 1050 - 2010 ROAD | 2 | | 1050LAWRENCE ROAD | 2 | | 107 E 13TH ROAD | 2 | | 10TH ST & CHESTNUT ROAD | 2 | | 110 E 1ST ;27 | 2 | | 110 E 1ST ROAD | 2 | | 110 LOCUST | 2 | | 1197 W. 146 ROAD | 2 | | 12TH &SYCAMORE STS | 2 |
| | | Fire incidents reported |
|---|
| Sreet name | Count |
|---|
| 12TH ST | 2 | | 1378 W. DADE 182 ROAD | 2 | | 13TH STRE | 2 | | 13TH STREET ROAD | 2 | | 1430 N HWY 97 ROAD | 2 | | 160 & LOCUST STR | 2 | | 160 AND N DADE 55 ROAD | 2 | | 160 HIWAY | 2 | | 160 HWY | 2 | | 160 W SMITH PARK STR | 2 | | 164 RT BB ROAD | 2 | | 17TH ST | 2 | | 180 N DADE 51 ROAD | 2 | | 192 S 39 HWY ROAD | 2 | | 207 SYCAMORE STR | 2 | | 211 E 11TH ROAD | 2 | | 249 RT Z ROAD | 2 | | 251 NORHT DADE 21 ROAD | 2 | | 251 RT D ROAD | 2 | | 256 S DADE 91 ROAD | 2 | | 2M WEST ROAD | 2 | | 2ND ST | 2 | | 300 E. 7 TH STRE | 2 | | 302 N MAIN ST ROAD | 2 | | |
|
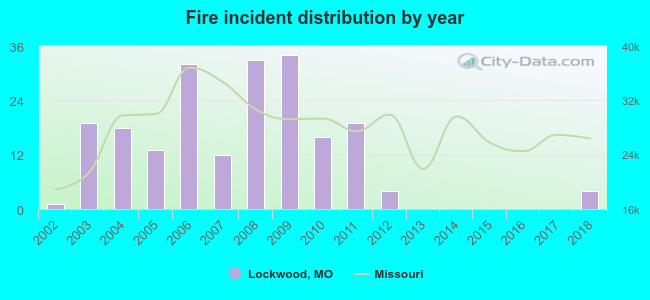 Based on the data from the years 2002 - 2018 the average number of fire incidents per year is 12. The highest number of fires - 34 took place in 2009, and the least - 0 in 2013. The data has a growing trend.
 26.8% incidents where reported in the morning and 73.2% in the evening. The most fires (20.5%) took place on Monday, and the least (11.7%) on Tuesday.
 According to the 205 fire incident reports from years 2002 - 2018 most fires (16.1%) took place during March, and the least (3.4%) in May.
 Out of all 231 cases reported during the years 2002 - 2018, the most belonged to the categories: Fire (88.7%), Rescue & EMS (4.8%), and Overpressure Rupture (3.9%).
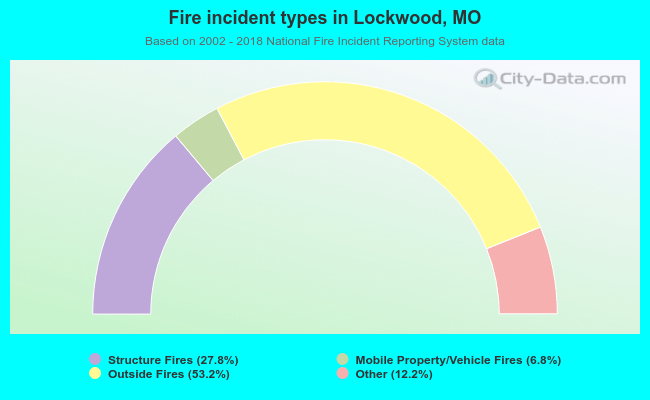 When looking into fire subcategories, the most reports belonged to: Outside Fires (53.2%), and Structure Fires (27.8%).