Lone Grove: Fire Incidents, Oklahoma (OK)
Where are fire incidents reported in Lone Grove, OK
Something went wrong! Please refresh the page.
|
| |||||||||||||||||||||||||||||||||||||||||||||||||||||||||||||||||||||||||||||||||||||||||||||||||||||||||||||
| Other | 15 | |||||||||||||||||||||||||||||||||||||||||||||||||||||||||||||||||||||||||||||||||||||||||||||||||||||||||||||
2005 - 2018 National Fire Incident Reporting System (NFIRS) incidents
- Incident types reported to NFIRS in Lone Grove, OK
- 1,23881.3%Rescue & EMS
- 16110.6%Fire
- 603.9%Hazardous Condition
- 422.8%Good Intent Call
- 161.1%False Alarm
- 50.3%Service Call
- Fire incident types reported to NFIRS in Lone Grove, OK
- 12477.0%Outside Fires
- 1811.2%Structure Fires
- 138.1%Other
- 63.7%Mobile Property/Vehicle Fires
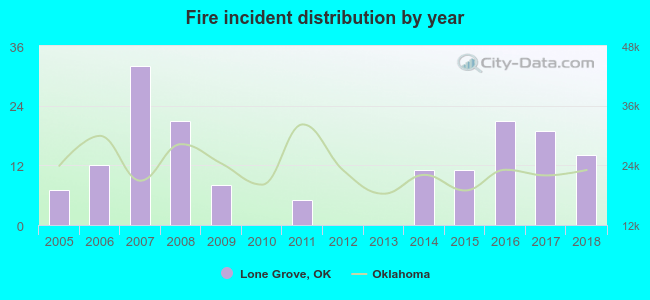 According to the data from the years 2005 - 2018 the average number of fires per year is 12. The highest number of fires - 32 took place in 2007, and the least - 0 in 2010. The data has a growing trend.
The average number of yearly fire incidents per 10k residents in Lone Grove, OK compared to nearest cities:
(Note: Based on data for the last 3 years, including only cities with population 5,000 and above)
| Lone Grove: | 34.5 |
| Ardmore: | 61.8 |
| Sulphur: | 169.6 |
| Pauls Valley: | 165.8 |

 18.0% incidents where reported in the morning and 82.0% in the evening. The most fires (19.9%) took place on Sunday, and the least (11.2%) on Tuesday.
 According to the 161 reports from years 2005 - 2018 most fires (19.3%) took place during February, and the least (1.9%) in May.
 Out of all 1,523 cases reported during the years 2005 - 2018, the most belonged to the categories: Overpressure Rupture (81.3%), Fire (10.6%), and Rescue & EMS (3.9%).
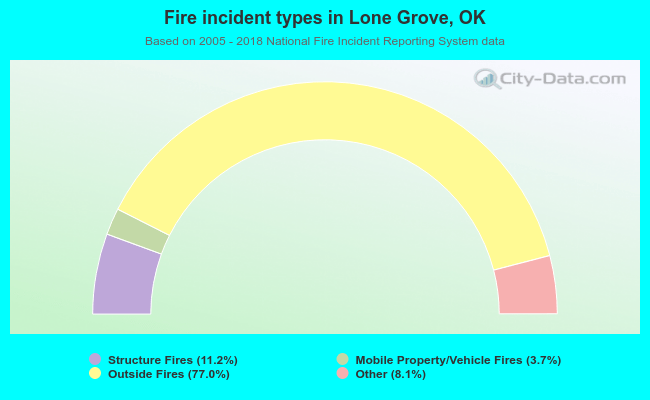 When looking into fire subcategories, the most incidents belonged to: Outside Fires (77.0%), and Structure Fires (11.2%).