Lone Star: Fire Incidents, Texas (TX)
Where are fire incidents reported in Lone Star, TX
Something went wrong! Please refresh the page.
|
| |||||||||||||||||||||||||||||||||||||||||||||||||||||||||||||||||||||||||||||||||||||||||||||||||||||||||||||
2002 - 2018 National Fire Incident Reporting System (NFIRS) incidents
- Incident types reported to NFIRS in Lone Star, TX
- 66047.9%Rescue & EMS
- 46934.0%Fire
- 1077.8%Hazardous Condition
- 836.0%Service Call
- 433.1%Good Intent Call
- 80.6%False Alarm
- 40.3%Severe Weather
- 40.3%Special Incident
- Fire incident types reported to NFIRS in Lone Star, TX
- 23550.1%Outside Fires
- 14330.5%Structure Fires
- 5511.7%Other
- 367.7%Mobile Property/Vehicle Fires
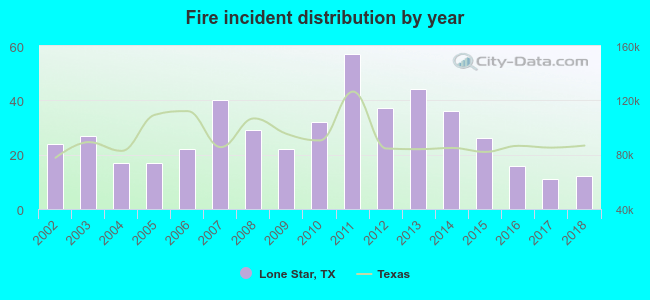 According to the data from the years 2002 - 2018 the average number of fires per year is 28. The highest number of fires - 57 took place in 2011, and the least - 11 in 2017. The data has a declining trend.
 31.6% incidents where reported in the morning and 68.4% in the evening. The most fires (15.6%) took place on Monday, and the least (12.2%) on Wednesday.
 Based on the 469 fires from years 2002 - 2018 most fires (11.1%) took place during December, and the least (3.6%) in November.
 Out of all 1,379 cases reported during the years 2002 - 2018, the most belonged to the categories: Rescue & EMS (47.9%), Fire (34.0%), and Hazardous Condition (7.8%).
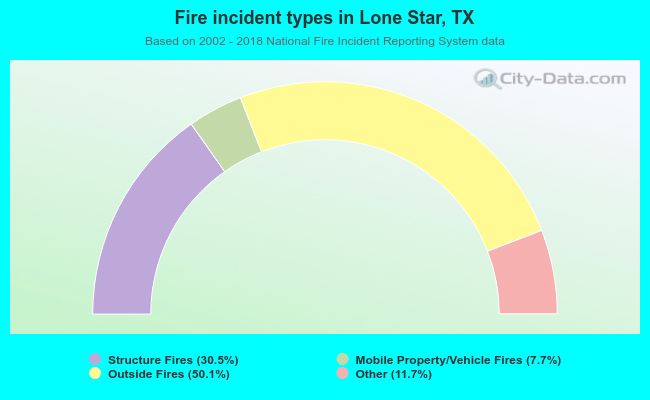 When looking into fire subcategories, the most reports belonged to: Outside Fires (50.1%), and Structure Fires (30.5%).