Los Altos Hills: Fire Incidents, California (CA)
Where are fire incidents reported in Los Altos Hills, CA
Something went wrong! Please refresh the page.
|
| |||||||||||||||||||||||||||||||||||||||||||||||||||||||||||||||||||||||||||||||||||||||||||||||||||||||||||||
2005 - 2018 National Fire Incident Reporting System (NFIRS) incidents
- Incident types reported to NFIRS in Los Altos Hills, CA
- 1,33845.6%Rescue & EMS
- 56019.1%Good Intent Call
- 2889.8%Hazardous Condition
- 2739.3%Service Call
- 2628.9%False Alarm
- 2077.1%Fire
- 60.2%Special Incident
- Fire incident types reported to NFIRS in Los Altos Hills, CA
- 8139.1%Outside Fires
- 6631.9%Mobile Property/Vehicle Fires
- 5024.2%Structure Fires
- 104.8%Other
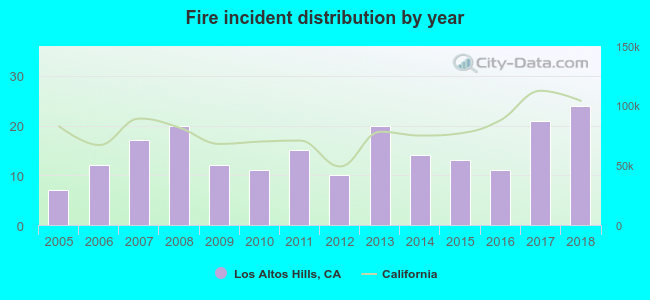 According to the data from the years 2005 - 2018 the average number of fire incidents per year is 15. The highest number of reported fire incidents - 24 took place in 2018, and the least - 7 in 2005. The data has a rising trend.
The average number of yearly fire incidents per 10k residents in Los Altos Hills, CA compared to nearest cities:
(Note: Based on data for the last 3 years, including only cities with population 5,000 and above)
| Los Altos Hills: | 22.2 |
| Los Altos: | 11.9 |
| Mountain View: | 5.5 |
| Stanford: | 21.7 |
| Palo Alto: | 18.5 |
| Sunnyvale: | 9.6 |
| Menlo Park: | 21.6 |
| Cupertino: | 13.1 |
| East Palo Alto: | 20.3 |

 34.8% incidents where reported in the morning and 65.2% in the evening. The most fires (19.3%) took place on Friday, and the least (9.7%) on Sunday.
 Based on the 207 reports from years 2005 - 2018 most fires (15.0%) took place during June, and the least (4.3%) in December.
 Out of all 2,936 cases reported during the years 2005 - 2018, the most belonged to the categories: Rescue & EMS (45.6%), Good Intent Call (19.1%), and Hazardous Condition (9.8%).
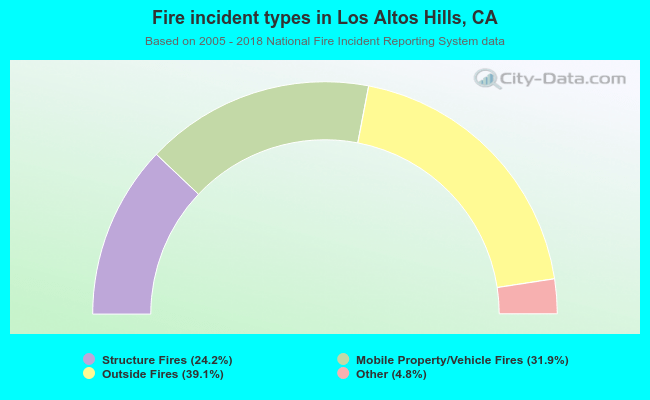 When looking into fire subcategories, the most incidents belonged to: Outside Fires (39.1%), and Mobile Property/Vehicle Fires (31.9%).