| Fire incidents reported |
|---|
| Sreet name | Count |
|---|
| SPOTTED TAIL | 24 | | WEST BRULE | 22 | | SITTING BULL | 14 | | IRON NEST | 12 | | GALL | 8 | | BIA ROUTE 5 | 6 | | IRON NATION | 6 | | IRON NEST ST | 6 | | LITTLE BEND RD | 6 | | 137 IRON NEST ST | 4 | | 404 SPOTTED HAWK ST | 4 | | BIA ROUTE 10 | 4 | | CRAZY HORSE | 4 | | CRAZY HORSE ST. | 4 | | CRAZY HORSE STREET | 4 | | GALL ST | 4 | | GALL STREET | 4 | | HWY 1806 | 4 | | IRON NEST ST. | 4 | | LITTLE BEND ROAD | 4 | | POW WOW HIGHWAY | 4 | | SPLINTERED HORN | 4 | | YELLOW HAWK STREET | 4 | | 111 MAINTENANCE BIA 10 | 2 | | 116 IRON NEST | 2 |
| | | Fire incidents reported |
|---|
| Sreet name | Count |
|---|
| 12 MILE NORTH OF KENNEBEC | 2 | | 187 SPLINTERED HORN AVE | 2 | | 202 OMAHA ST | 2 | | 293 TWO HAWK | 2 | | 403 SPOTTED HAWK ST | 2 | | 511 SPOTTED TAIL ST | 2 | | 98 CRAZY BULL ST | 2 | | BEAR BUTTE AVE | 2 | | BIA 10 | 2 | | BIA 10 SICANGU DR | 2 | | BIA HIGHWAY 10 | 2 | | BIA ROUTE 17 | 2 | | BULL HEAD STREET | 2 | | BULLHEAD STREET | 2 | | CASINO PARKING LOT | 2 | | CRAZY HORSE ST | 2 | | DIRT TRAIL | 2 | | FT HALE | 2 | | FT. HALE BOTTOM | 2 | | GAUL ST | 2 | | GROUSE ST | 2 | | GULL ST | 2 | | HIGHWAY 47 | 2 | | HWY 47 | 2 | | IRON NATION SOUTH | 2 |
|
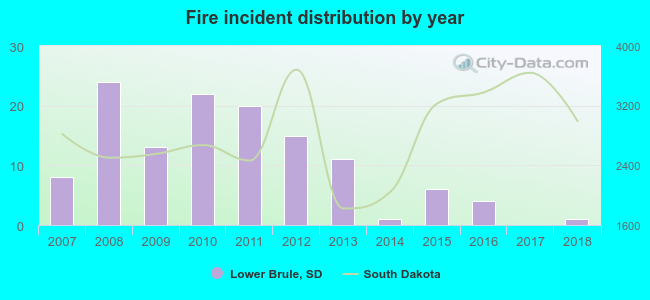 Based on the data from the years 2007 - 2018 the average number of fire incidents per year is 10. The highest number of reported fire incidents - 24 took place in 2008, and the least - 0 in 2017. The data has a decreasing trend.
 44.0% incidents where reported in the morning and 56.0% in the evening. The most fires (20.0%) took place on Monday, and the least (9.6%) on Tuesday.
 According to the 125 fires from years 2007 - 2018 most fires (15.2%) took place during June, and the least (2.4%) in December.
 Out of all 137 cases reported during the years 2007 - 2018, the most belonged to the categories: Fire (91.2%), Rescue & EMS (7.3%), and Overpressure Rupture (1.5%).
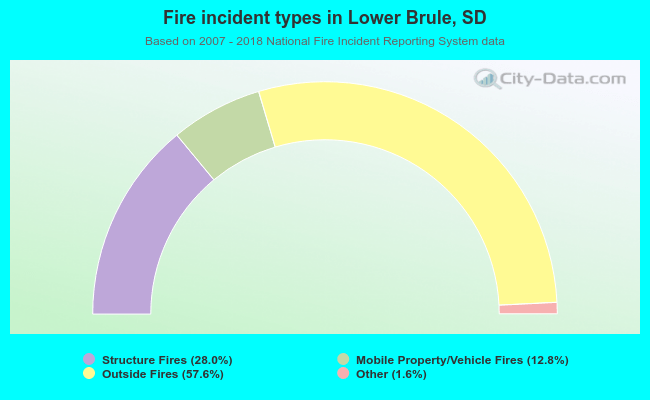 When looking into fire subcategories, the most incidents belonged to: Outside Fires (57.6%), and Structure Fires (28.0%).