Lucas: Fire Incidents, Texas (TX)
Where are fire incidents reported in Lucas, TX
Something went wrong! Please refresh the page.
|
| |||||||||||||||||||||||||||||||||||||||||||||||||||||||||||||||||||||||||||||||||||||||||||||||||||||||||||||
2004 - 2018 National Fire Incident Reporting System (NFIRS) incidents
- Incident types reported to NFIRS in Lucas, TX
- 1,18539.1%Rescue & EMS
- 76325.2%Fire
- 38012.5%Service Call
- 31810.5%Good Intent Call
- 1896.2%Hazardous Condition
- 1565.1%False Alarm
- 280.9%Special Incident
- 100.3%Severe Weather
- Fire incident types reported to NFIRS in Lucas, TX
- 45259.2%Outside Fires
- 23030.1%Structure Fires
- 455.9%Mobile Property/Vehicle Fires
- 364.7%Other
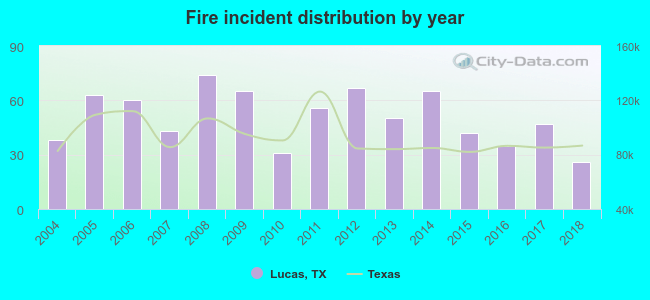 According to the data from the years 2004 - 2018 the average number of fire incidents per year is 51. The highest number of reported fires - 74 took place in 2008, and the least - 26 in 2018. The data has a declining trend.
The average number of yearly fire incidents per 10k residents in Lucas, TX compared to nearest cities:
(Note: Based on data for the last 3 years, including only cities with population 5,000 and above)
| Lucas: | 54.9 |
| Fairview: | 41.5 |
| Allen: | 14.0 |
| Wylie: | 21.6 |
| Murphy: | 16.6 |
| Princeton: | 102.0 |
| McKinney: | 16.5 |
| Sachse: | 16.6 |
| Plano: | 14.4 |
 The median response time based on all reported fire incidents is 9 minutes. This is higher than the state median value.
The median response time in Lucas, TX compared to nearest cities:
(Note: Based on data for all years, including only cities with at least 500 fire incidents)
| Lucas: | 9 minutes |
| Allen: | 6 minutes |
| Wylie: | 6 minutes |
| Princeton: | 11 minutes |
| McKinney: | 6 minutes |
| Sachse: | 6 minutes |
| Plano: | 5 minutes |
| Richardson: | 5 minutes |
| Melissa: | 8 minutes |
 26.6% incidents where reported in the morning and 73.4% in the evening. The most fires (16.5%) took place on Saturday, and the least (12.2%) on Monday.
 According to the 763 fires from years 2004 - 2018 most fires (11.3%) took place during November, and the least (5.6%) in April.
 Out of all 3,031 cases reported during the years 2004 - 2018, the most belonged to the categories: Rescue & EMS (39.1%), Fire (25.2%), and Service Call (12.5%).
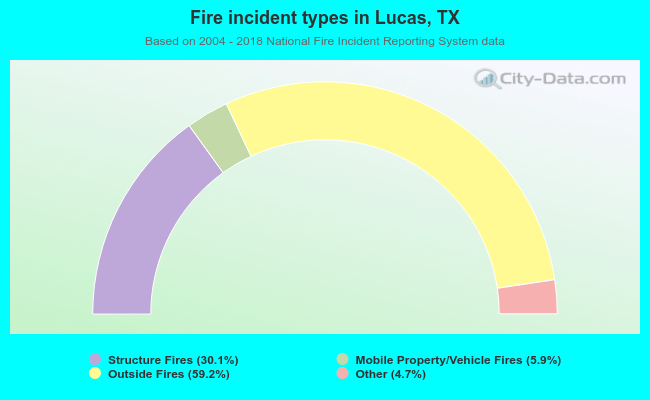 When looking into fire subcategories, the most incidents belonged to: Outside Fires (59.2%), and Structure Fires (30.1%).