| Fire incidents reported |
|---|
| Sreet name | Count |
|---|
| TIBET HWY | 22 | | ARNOLD DR | 14 | | MOODY BRIDGE RD | 14 | | RYE PATCH RD | 14 | | GROOVER RD | 12 | | MACON ST | 12 | | MCDONALD ST | 12 | | MILLPOND RD | 12 | | TIBET RD | 12 | | DELOACH RD | 10 | | ELIM CHURCH RD | 10 | | GRIFFIN RD | 10 | | HWY 196 | 10 | | PEARL DAVIS RD | 10 | | RYE-PATCH RD | 10 | | STAFFORD DAIRY RD | 10 | | ARCHER RD | 8 | | BUSTER PHILLIPS RD | 8 | | HIGHWAY 196 | 8 | | HWY 57 | 8 | | MAIN ST | 8 | | PEARL DAVIS RD. | 8 | | 84 HWY | 6 | | BARRETT CEMETERY RD | 6 | | HWY 301 | 6 |
| | | Fire incidents reported |
|---|
| Sreet name | Count |
|---|
| HWY 84 | 6 | | MILL POND RD | 6 | | SANDHILL RD | 6 | | SIMMONS MILL POND RD | 6 | | STEWART HODGES LOOP | 6 | | TIBET RD. | 6 | | TIMESAVER RD | 6 | | ARCHER RD. | 4 | | BELL RD | 4 | | BOUNDARY ST | 4 | | CAROLYN LN | 4 | | CYPRESS ST | 4 | | ELAM CHURCH RD | 4 | | FRANKLIN ST | 4 | | FRAZIER HARRIS RD | 4 | | FUTCH LN | 4 | | GEORGE SWINDELL RD | 4 | | GLENN GROOVER RD | 4 | | HIGHWAY 57 | 4 | | HIGHWAY 57 HWY | 4 | | HWY 57 SOUTH | 4 | | HWY 84 HWY | 4 | | HWY. 84 | 4 | | ILLAM CHURCH RD. | 4 | | |
|
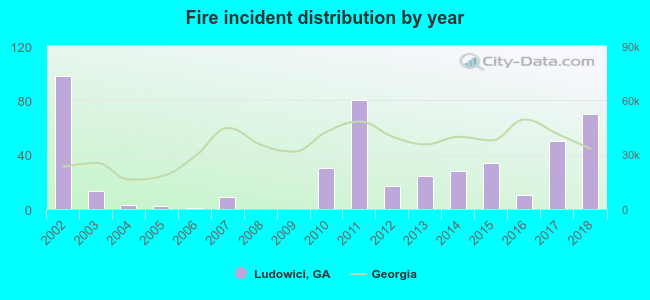 Based on the data from the years 2002 - 2018 the average number of fires per year is 28. The highest number of fires - 98 took place in 2002, and the least - 0 in 2008. The data has a declining trend.
 25.4% incidents where reported in the morning and 74.6% in the evening. The most fires (18.1%) took place on Saturday, and the least (11.3%) on Monday.
 According to the 469 incident reports from years 2002 - 2018 most fires (17.3%) took place during March, and the least (2.6%) in November.
 Out of all 1,725 cases reported during the years 2002 - 2018, the most belonged to the categories: Rescue & EMS (48.2%), Fire (27.2%), and Good Intent Call (8.3%).
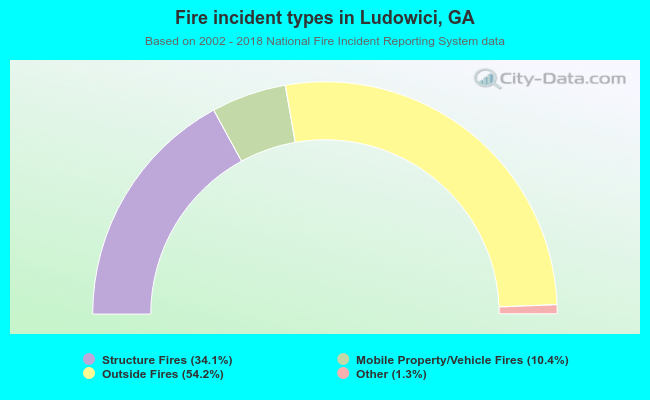 When looking into fire subcategories, the most reports belonged to: Outside Fires (54.2%), and Structure Fires (34.1%).