Lunenburg: Fire Incidents, Massachusetts (MA)
Where are fire incidents reported in Lunenburg, MA
Something went wrong! Please refresh the page.
| Fire incidents reported | |
|---|---|
| Sreet name | Count |
| MASSACHUSETTS AVE | 134 |
| MASS AV | 94 |
| LANCASTER AVE | 44 |
| WHITE ST | 42 |
| CHASE RD | 32 |
| BURRAGE ST | 30 |
| PAGE ST | 30 |
| NEW WEST TOWNSEND RD | 28 |
| GOODRICH ST | 26 |
| RESERVOIR RD | 24 |
| SUMMER ST | 24 |
| TOWNSEND HARBOR RD | 24 |
| ARBOR ST | 22 |
| PRATT ST | 22 |
| WHALOM RD | 22 |
| LANCASTER AV | 20 |
| MULPUS RD | 20 |
| LEOMINSTER RD | 18 |
| WEST ST | 18 |
| ISLAND RD | 16 |
| LEOMINSTERSHIRLEY RD | 16 |
| SUNNY HILL RD | 16 |
| ELECTRIC AVE | 14 |
| LEOM-SHIRLEY RD | 14 |
| MAIN ST | 14 |
| NORTHFIELD RD | 14 |
| RESERVOIR RD | 14 |
| WEST TOWNSEND RD | 14 |
| BURRAGE ST | 12 |
| CROSS RD | 12 |
2002 - 2018 National Fire Incident Reporting System (NFIRS) incidents
- Incident types reported to NFIRS in Lunenburg, MA
- 1,04929.1%Hazardous Condition
- 77921.6%Fire
- 64818.0%Rescue & EMS
- 41211.4%Service Call
- 39310.9%False Alarm
- 3038.4%Good Intent Call
- 180.5%Special Incident
- 60.2%Severe Weather
- Fire incident types reported to NFIRS in Lunenburg, MA
- 43956.4%Structure Fires
- 21928.1%Outside Fires
- 8210.5%Mobile Property/Vehicle Fires
- 395.0%Other
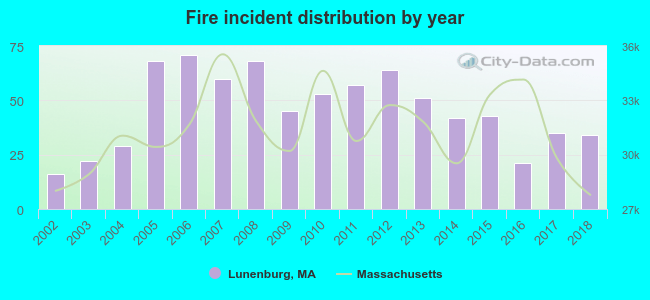 According to the data from the years 2002 - 2018 the average number of fires per year is 46. The highest number of reported fire incidents - 71 took place in 2006, and the least - 16 in 2002. The data has a growing trend.
 The median response time based on all reported fire incidents is 6 minutes. This is higher than the state median value.
The median response time in Lunenburg, MA compared to nearest cities:
(Note: Based on data for all years, including only cities with at least 500 fire incidents)
| Lunenburg: | 6 minutes |
| Fitchburg: | 4 minutes |
| Leominster: | 4 minutes |
| Ayer: | 4 minutes |
| Harvard: | 9 minutes |
| Pepperell: | 4 minutes |
| Westminster: | 6 minutes |
| Sterling: | 6 minutes |
| Clinton: | 3 minutes |
 Based on the reports from the years 2002 - 2018 the average number of fire-related yearly deaths is 0. The highest number of deaths - 1 took place in 2008, and the lowest - 0 in 2002. The data has a constant trend.
 Based on the reports from the years 2002 - 2018 the average number of fire-related casualties per year is 1. The highest number of reported casualties - 3 took place in 2007, and the lowest - 0 in 2004. The data has a decreasing trend.
The average number of injuries per 1,000 fire incidents is 16. This indicator was the highest - 63 in 2002, and the lowest 0 in 2004. The trend for casualties per 1,000 fires is declining. Compared to the Massachusetts value the number of casualties per 1,000 fire incidents is higher.
Based on the reports from the years 2002 - 2018 the average number of fire-related casualties per year is 1. The highest number of reported casualties - 3 took place in 2007, and the lowest - 0 in 2004. The data has a decreasing trend.
The average number of injuries per 1,000 fire incidents is 16. This indicator was the highest - 63 in 2002, and the lowest 0 in 2004. The trend for casualties per 1,000 fires is declining. Compared to the Massachusetts value the number of casualties per 1,000 fire incidents is higher.Casualties per 1,000 incidents in Lunenburg, MA compared to nearest cities:
(Note: Based on data for all years, including only cities with at least 500 fire incidents)
| Lunenburg: | 15.4 |
| Fitchburg: | 15.4 |
| Leominster: | 10.6 |
| Ayer: | 8.5 |
| Harvard: | 2.0 |
| Pepperell: | 23.4 |
| Westminster: | 10.7 |
| Sterling: | 7.7 |
| Clinton: | 5.5 |
 30.2% incidents where reported in the morning and 69.8% in the evening. The most fires (17.5%) took place on Friday, and the least (10.9%) on Wednesday.
 Based on the 779 fires from years 2002 - 2018 most fires (13.6%) took place during April, and the least (4.5%) in September.
 Out of all 3,610 cases reported during the years 2002 - 2018, the most belonged to the categories: Hazardous Condition (29.1%), Fire (21.6%), and Rescue & EMS (18.0%).
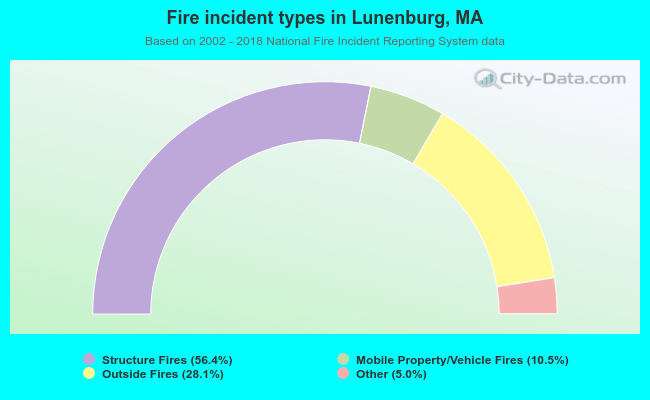 When looking into fire subcategories, the most reports belonged to: Structure Fires (56.4%), and Outside Fires (28.1%).