| Fire incidents reported |
|---|
| Sreet name | Count |
|---|
| MCBRIDE ST. | 10 | | BLAND RD | 8 | | CLARKSTON RD | 8 | | HOG PEN RD | 8 | | MCMULLEN RD | 8 | | MS HWY 15 | 8 | | STURGIS MABEN RD | 8 | | 2193 POLLY BELL RD | 6 | | 311 5TH AVE | 6 | | BARNETT RD | 6 | | BERRY RD | 6 | | HATCHER RD | 6 | | HATCHER RD | 6 | | HAWKINS | 6 | | HWY 50 | 6 | | MS 15 HWY | 6 | | MS HWY 50 | 6 | | THOMPSON RD | 6 | | 144 RAILROAD AVE | 4 | | 2740 BERRY RD | 4 | | 3466 SELF CREEK RD | 4 | | 447 SANDERS TRAILER PK | 4 | | 5TH AVE | 4 | | 608 CUMBERLAND RD. | 4 | | A. W. WILLIAMS RD. | 4 |
| | | Fire incidents reported |
|---|
| Sreet name | Count |
|---|
| ALLEN RD | 4 | | ANTIOCK CHURCH RD | 4 | | COLE RD | 4 | | COUNTY LINE RD | 4 | | COUNTY LINE RD. | 4 | | CUMBERLAND RD | 4 | | CUMBERLAND RD OFF HWY 15 | 4 | | FIRETOWER RD | 4 | | HATCHER ROAD | 4 | | HAWKINS RD | 4 | | HOG PEN RD. | 4 | | HWY 15 | 4 | | HWY 15 NORTH | 4 | | HWY 50 CUMBERLAND HWY | 4 | | HWY 50 EAST CUMBERLAND | 4 | | HWY 82 | 4 | | J.Y. TURNER RD. | 4 | | JACKSON RD | 4 | | LOVE HILL RD | 4 | | MABEN STURGIS RD | 4 | | NEELY RD | 4 | | NORRIS DEAN RD | 4 | | OLD HWY 10 | 4 | | SELF CREEK RD | 4 | | |
|
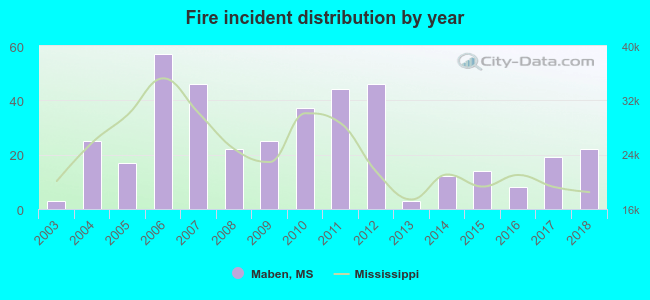 Based on the data from the years 2003 - 2018 the average number of fires per year is 25. The highest number of fire incidents - 57 took place in 2006, and the least - 3 in 2003. The data has an increasing trend.
 28.8% incidents where reported in the morning and 71.3% in the evening. The most fires (17.5%) took place on Saturday, and the least (11.5%) on Sunday.
 Based on the 400 fire incident reports from years 2003 - 2018 most fires (13.8%) took place during March, and the least (5.0%) in May.
 Out of all 922 cases reported during the years 2003 - 2018, the most belonged to the categories: Rescue & EMS (50.7%), Fire (43.4%), and Hazardous Condition (2.5%).
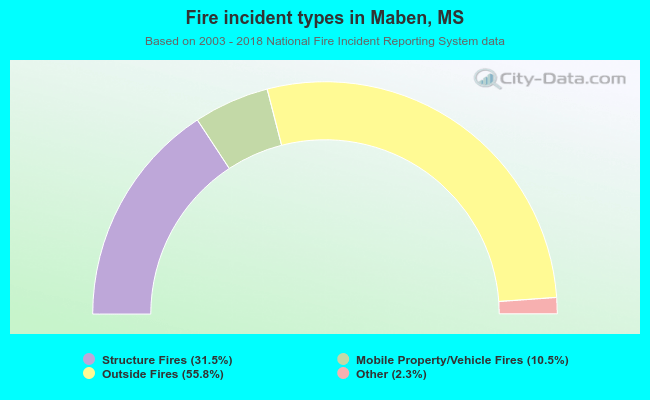 When looking into fire subcategories, the most incidents belonged to: Outside Fires (55.8%), and Structure Fires (31.5%).