Madison: Fire Incidents, Wisconsin (WI)
Where are fire incidents reported in Madison, WI
Something went wrong! Please refresh the page.
| Fire incidents reported | |
|---|---|
| Sreet name | Count |
| JOHNSON ST | 96 |
| WASHINGTON AVE | 96 |
| LANGDON ST | 94 |
| PARK ST | 78 |
| BADGER RD | 76 |
| WASHINGTON AV | 66 |
| NORTHPORT DR | 58 |
| SCHROEDER RD | 58 |
| GORHAM ST | 56 |
| BELTLINE HY | 54 |
| FISH HATCHERY RD | 54 |
| INTERSTATE - 90 FWY | 54 |
| DEER VALLEY RD | 52 |
| MOORLAND RD | 52 |
| MIFFLIN ST | 50 |
| MINERAL POINT RD | 50 |
| DAYTON ST | 48 |
| MAIN ST | 46 |
| THOMPSON DR | 44 |
| WILSON ST | 44 |
| ALLIED DR | 42 |
| STOUGHTON RD | 42 |
| UNIVERSITY AV | 42 |
| STATE ST | 38 |
| TROY DR | 38 |
| HENRY ST | 36 |
| WOODVIEW CT | 36 |
| FRANCES ST | 34 |
| GAMMON RD | 34 |
| PHEASANT RIDGE TR | 34 |
| Other | 1,829 |
2002 - 2018 National Fire Incident Reporting System (NFIRS) incidents
- Incident types reported to NFIRS in Madison, WI
- 42,42261.5%Rescue & EMS
- 6,7319.8%False Alarm
- 6,1719.0%Good Intent Call
- 5,2767.7%Hazardous Condition
- 4,5136.5%Service Call
- 3,4315.0%Fire
- 2210.3%Special Incident
- 1290.2%Overpressure Rupture
- Fire incident types reported to NFIRS in Madison, WI
- 1,57145.8%Structure Fires
- 1,05130.6%Outside Fires
- 60117.5%Mobile Property/Vehicle Fires
- 2086.1%Other
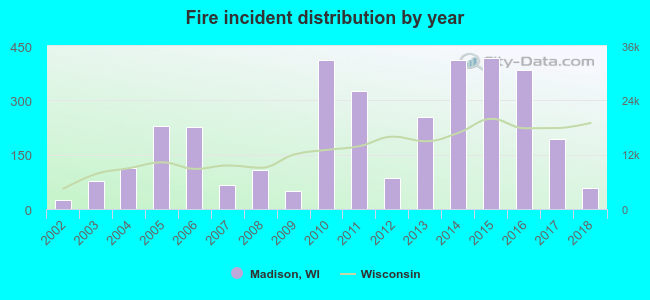 According to the data from the years 2002 - 2018 the average number of fires per year is 202. The highest number of reported fire incidents - 416 took place in 2015, and the least - 25 in 2002. The data has an increasing trend.
The average number of yearly fire incidents per 10k residents in Madison, WI compared to nearest cities:
(Note: Based on data for the last 3 years, including only cities with population 5,000 and above)
| Madison: | 8.6 |
| Monona: | 25.4 |
| Fitchburg: | 33.1 |
| Middleton: | 24.1 |
| McFarland: | 33.0 |
| Waunakee: | 17.1 |
| Verona: | 27.8 |
| Cottage Grove: | 45.0 |
| Oregon: | 24.0 |
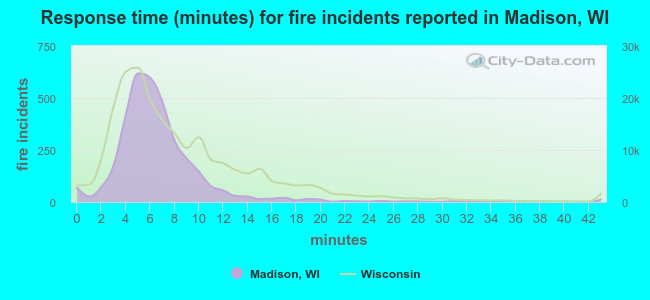 The median response time based on all reported fire incidents is 6 minutes. This is similar to the Wisconsin median value.
The median response time in Madison, WI compared to nearest cities:
(Note: Based on data for all years, including only cities with at least 500 fire incidents)
| Madison: | 6 minutes |
| Fitchburg: | 7 minutes |
| Middleton: | 6 minutes |
| Sun Prairie: | 8 minutes |
| Edgerton: | 10 minutes |
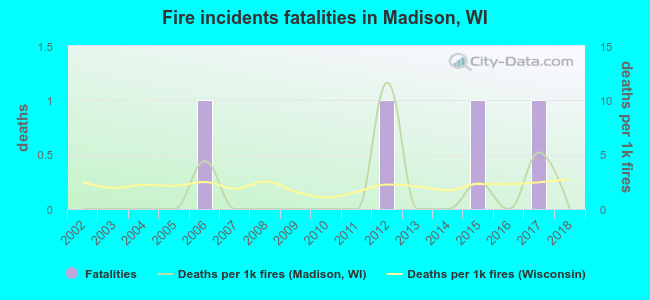 Based on the reports from the years 2002 - 2018 the average number of fire-related fatalities per year is 0. The highest number of reported deaths - 1 took place in 2006, and the lowest - 0 in 2002. The data has a constant trend.
The average number of deaths per 1,000 fire incidents is 1. This indicator was the highest - 12 in 2012, and the lowest 0 in 2002. The trend for deaths per 1,000 incidents is constant. Compared to the state value the number of deaths per 1,000 fires is lower.
Based on the reports from the years 2002 - 2018 the average number of fire-related fatalities per year is 0. The highest number of reported deaths - 1 took place in 2006, and the lowest - 0 in 2002. The data has a constant trend.
The average number of deaths per 1,000 fire incidents is 1. This indicator was the highest - 12 in 2012, and the lowest 0 in 2002. The trend for deaths per 1,000 incidents is constant. Compared to the state value the number of deaths per 1,000 fires is lower.Deaths per 1,000 incidents in Madison, WI compared to nearest cities:
(Note: Based on data for all years, including only cities with at least 2,500 fire incidents)
| Madison: | 1.2 |
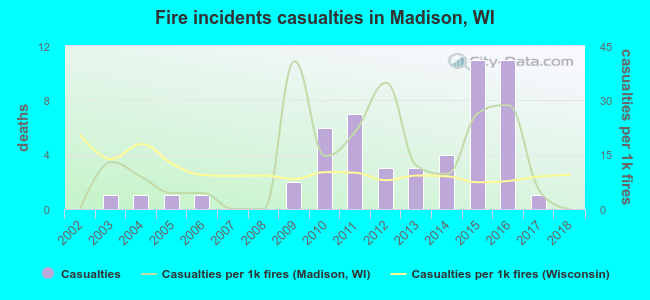 Based on the data from the years 2002 - 2018 the average number of fire-related yearly casualties is 3. The highest number of reported casualties - 11 took place in 2015, and the lowest - 0 in 2002. The data has a constant trend.
The average number of casualties per 1,000 fire incidents is 13. This indicator was the highest - 41 in 2009, and the lowest 0 in 2002. The trend for casualties per 1,000 fires is rising. Compared to the Wisconsin value the number of injuries per 1,000 incidents is higher.
Based on the data from the years 2002 - 2018 the average number of fire-related yearly casualties is 3. The highest number of reported casualties - 11 took place in 2015, and the lowest - 0 in 2002. The data has a constant trend.
The average number of casualties per 1,000 fire incidents is 13. This indicator was the highest - 41 in 2009, and the lowest 0 in 2002. The trend for casualties per 1,000 fires is rising. Compared to the Wisconsin value the number of injuries per 1,000 incidents is higher.Casualties per 1,000 incidents in Madison, WI compared to nearest cities:
(Note: Based on data for all years, including only cities with at least 500 fire incidents)
| Madison: | 15.2 |
| Fitchburg: | 9.2 |
| Middleton: | 0.0 |
| Sun Prairie: | 4.0 |
| Edgerton: | 0.0 |
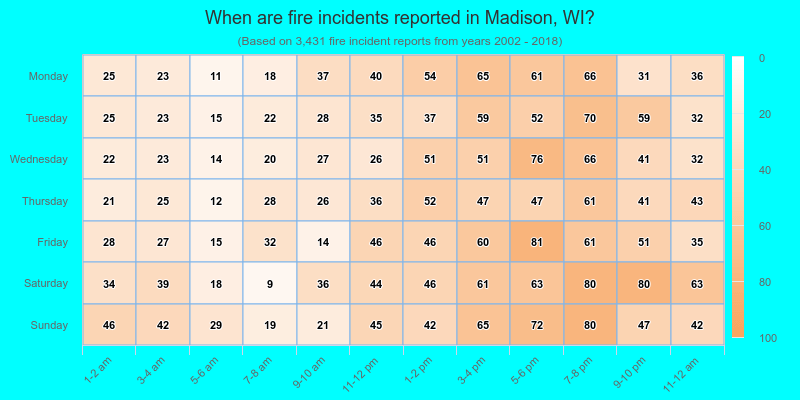
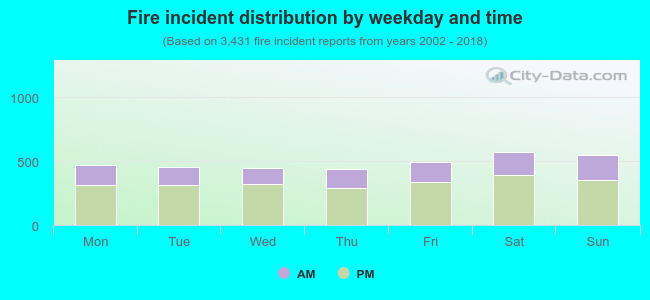 32.8% incidents where reported in the morning and 67.2% in the evening. The most fires (16.7%) took place on Saturday, and the least (12.8%) on Thursday.
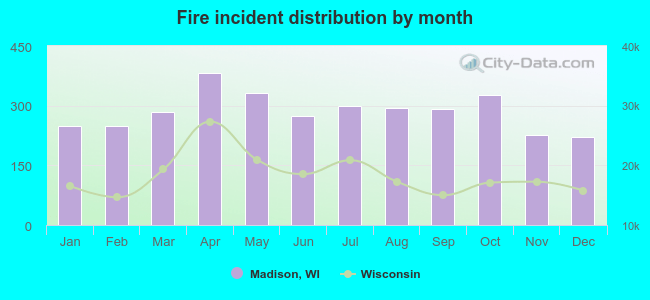 Based on the 3,431 fire incident reports from years 2002 - 2018 most fires (11.2%) took place during April, and the least (6.4%) in December.
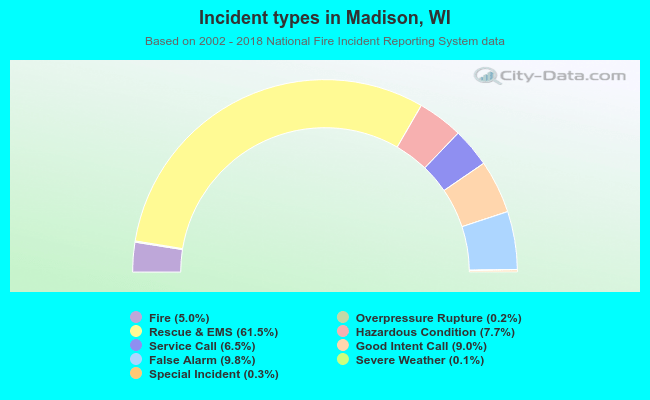 Out of all 68,939 cases reported during the years 2002 - 2018, the most belonged to the categories: Rescue & EMS (61.5%), False Alarm (9.8%), and Good Intent Call (9.0%).
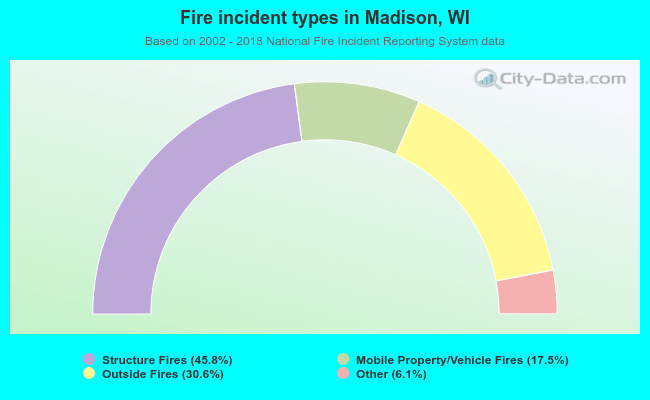 When looking into fire subcategories, the most reports belonged to: Structure Fires (45.8%), and Outside Fires (30.6%).