| Fire incidents reported |
|---|
| Sreet name | Count |
|---|
| 9938 W 650 S | 6 | | MANILLA FIRE STATION | 6 | | 6089 S. 900 W. | 4 | | 8336 W. 200 S. | 4 | | 9353 W. JACKSON STREET | 4 | | 9571 W 250 S | 4 | | 100 S | 2 | | 1000 W. 950 E. | 2 | | 125 | 2 | | 1499 NORTH 725 WEST | 2 | | 1644 S 750 W | 2 | | 1644 S. 750 W. | 2 | | 1725 N 600 E | 2 | | 175 | 2 | | 1907 N. 600 E. | 2 | | 200 S. ST. RD. 44 | 2 | | 2058 S 750 W | 2 | | 2098 S 925 W | 2 | | 240 ELIZABETH DRIVE | 2 | | 2407 N. 475 E. | 2 | | 241 S. 715 W. | 2 | | 2447 S. 715 W. | 2 | | 250 | 2 | | 250 S. AND CROSS STREET | 2 | | 2505 SOUTH 925 WEST | 2 |
| | | Fire incidents reported |
|---|
| Sreet name | Count |
|---|
| 250S 450 W | 2 | | 2590 S W ASHINGTON STREET | 2 | | 2600 S. 725 W. | 2 | | 2706 WASHINGTON STREET | 2 | | 2740 CROSS ST. | 2 | | 2776 N 450 E | 2 | | 2840 W. 300 S. | 2 | | 2885 S CROSS STREET | 2 | | 2901 CROSS STEET | 2 | | 2971 S CROSS STREET | 2 | | 322 S. 400 W. | 2 | | 3387 S 375 E | 2 | | 3423 S. 775 E. | 2 | | 3617 N. LITTLE BLUE RD. | 2 | | 3755 E. GERMAN RD. | 2 | | 4354 S 725 W | 2 | | 4365 N 575 E | 2 | | 4503 N. 925 W. | 2 | | 455 S 900 W | 2 | | 4758 WEST 250 SOUTH | 2 | | 4871 W. 325 S. | 2 | | 4884 S 975 W | 2 | | 500 E. 700 N. | 2 | | 5009 S. 800 W. | 2 | | |
|
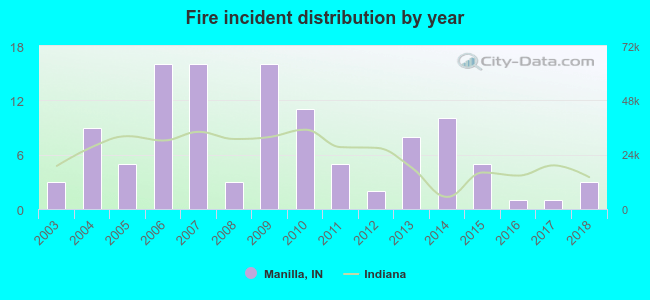 Based on the data from the years 2003 - 2018 the average number of fires per year is 7. The highest number of reported fire incidents - 16 took place in 2006, and the least - 1 in 2016. The data has a constant trend.
 28.9% incidents where reported in the morning and 71.1% in the evening. The most fires (17.5%) took place on Tuesday, and the least (12.3%) on Thursday.
 According to the 114 fire incident reports from years 2003 - 2018 most fires (16.7%) took place during March, and the least (4.4%) in July.
 Out of all 234 cases reported during the years 2003 - 2018, the most belonged to the categories: Fire (48.7%), Overpressure Rupture (30.8%), and Rescue & EMS (6.8%).
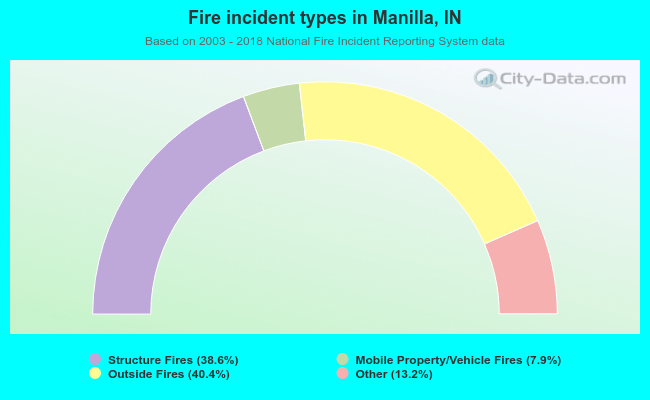 When looking into fire subcategories, the most incidents belonged to: Outside Fires (40.4%), and Structure Fires (38.6%).