Manito: Fire Incidents, Illinois (IL)
Where are fire incidents reported in Manito, IL
Something went wrong! Please refresh the page.
|
| |||||||||||||||||||||||||||||||||||||||||||||||||||||||||||||||||||||||||||||||||||||||||||||||||||||||||||||
| Other | 15 | |||||||||||||||||||||||||||||||||||||||||||||||||||||||||||||||||||||||||||||||||||||||||||||||||||||||||||||
2002 - 2018 National Fire Incident Reporting System (NFIRS) incidents
- Incident types reported to NFIRS in Manito, IL
- 45151.1%Fire
- 16018.1%Rescue & EMS
- 14015.9%Hazardous Condition
- 546.1%Service Call
- 525.9%Good Intent Call
- 182.0%False Alarm
- 60.7%Severe Weather
- 10.1%Special Incident
- Fire incident types reported to NFIRS in Manito, IL
- 20645.7%Outside Fires
- 19944.1%Structure Fires
- 429.3%Mobile Property/Vehicle Fires
- 40.9%Other
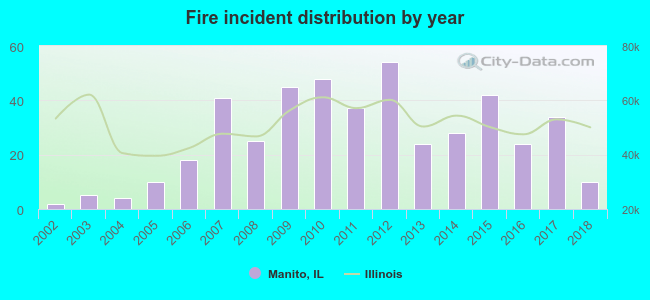 Based on the data from the years 2002 - 2018 the average number of fires per year is 27. The highest number of fires - 54 took place in 2012, and the least - 2 in 2002. The data has a rising trend.
 According to the data from the years 2002 - 2018 the average number of fire-related casualties per year is 0. The highest number of injuries - 2 took place in 2017, and the lowest - 0 in 2002. The data has a constant trend.
 28.6% incidents where reported in the morning and 71.4% in the evening. The most fires (16.6%) took place on Tuesday, and the least (11.8%) on Friday.
 According to the 451 reports from years 2002 - 2018 most fires (17.1%) took place during March, and the least (3.5%) in December.
 Out of all 882 cases reported during the years 2002 - 2018, the most belonged to the categories: Fire (51.1%), Overpressure Rupture (18.1%), and Rescue & EMS (15.9%).
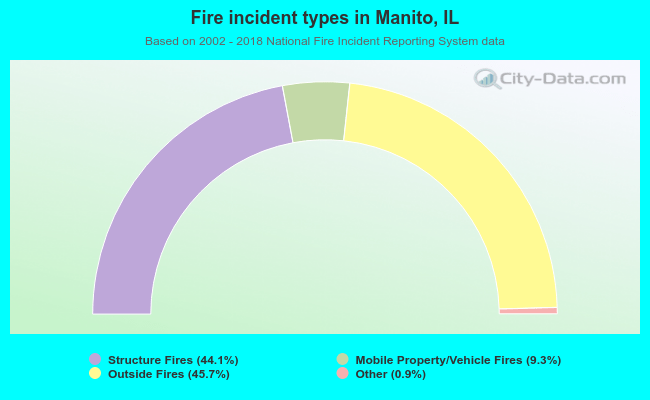 When looking into fire subcategories, the most reports belonged to: Outside Fires (45.7%), and Structure Fires (44.1%).