Manitowoc: Fire Incidents, Wisconsin (WI)
Where are fire incidents reported in Manitowoc, WI
Something went wrong! Please refresh the page.
| Fire incidents reported | |
|---|---|
| Sreet name | Count |
| 18TH ST | 126 |
| 8TH ST | 64 |
| CALUMET AVE | 62 |
| 10TH ST | 52 |
| WASHINGTON ST | 36 |
| 21ST ST | 34 |
| 35TH ST | 34 |
| DIVISION ST | 32 |
| RAPIDS RD | 32 |
| WALDO BLVD | 32 |
| ALVERNO RD | 30 |
| 16TH ST | 28 |
| 9TH ST | 28 |
| JOHNSTON DR | 28 |
| ALBERT DR | 24 |
| MENASHA AVE | 24 |
| UNION RD | 24 |
| 11TH ST | 22 |
| 14TH ST | 22 |
| 23RD ST | 22 |
| 30TH ST | 22 |
| EXPO DR | 22 |
| GRAND AVE | 22 |
| MADSON RD | 22 |
| 15TH ST | 20 |
| 5TH ST | 20 |
| CLARK ST | 20 |
| 24TH ST | 18 |
| 7TH ST | 18 |
| CUSTER ST | 16 |
| Other | 222 |
2004 - 2018 National Fire Incident Reporting System (NFIRS) incidents
- Incident types reported to NFIRS in Manitowoc, WI
- 1,17831.4%Fire
- 1,04227.8%Hazardous Condition
- 53114.1%Rescue & EMS
- 3589.5%Service Call
- 3449.2%False Alarm
- 2697.2%Good Intent Call
- 160.4%Overpressure Rupture
- 90.2%Special Incident
- 70.2%Severe Weather
- Fire incident types reported to NFIRS in Manitowoc, WI
- 67557.3%Structure Fires
- 26822.8%Outside Fires
- 16614.1%Mobile Property/Vehicle Fires
- 695.9%Other
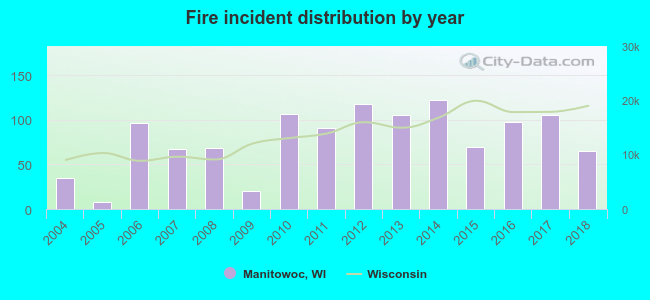 According to the data from the years 2004 - 2018 the average number of fires per year is 79. The highest number of reported fire incidents - 122 took place in 2014, and the least - 8 in 2005. The data has an increasing trend.
The average number of yearly fire incidents per 10k residents in Manitowoc, WI compared to nearest cities:
(Note: Based on data for the last 3 years, including only cities with population 5,000 and above)
| Manitowoc: | 27.1 |
| Two Rivers: | 34.1 |
| Sheboygan: | 31.4 |
| Sheboygan Falls: | 75.9 |
| Ledgeview: | 4.6 |
| Plymouth: | 77.1 |
| Bellevue: | 27.8 |
| De Pere: | 19.3 |
| Allouez: | 0.7 |
 The median response time based on all reported fire incidents is 5 minutes. This is lower than the Wisconsin median value.
 Based on the reports from the years 2004 - 2018 the average number of fire-related casualties per year is 2. The highest number of reported casualties - 7 took place in 2012, and the lowest - 0 in 2004. The data has a constant trend.
The average number of casualties per 1,000 fires is 22. This indicator was the highest - 59 in 2012, and the lowest 0 in 2004. The trend for casualties per 1,000 fire incidents is decreasing. Compared to the Wisconsin value the number of injuries per 1,000 fires is much higher.
Based on the reports from the years 2004 - 2018 the average number of fire-related casualties per year is 2. The highest number of reported casualties - 7 took place in 2012, and the lowest - 0 in 2004. The data has a constant trend.
The average number of casualties per 1,000 fires is 22. This indicator was the highest - 59 in 2012, and the lowest 0 in 2004. The trend for casualties per 1,000 fire incidents is decreasing. Compared to the Wisconsin value the number of injuries per 1,000 fires is much higher.
 36.8% incidents where reported in the morning and 63.2% in the evening. The most fires (18.0%) took place on Saturday, and the least (11.7%) on Tuesday.
 According to the 1,178 fire incident reports from years 2004 - 2018 most fires (10.2%) took place during July, and the least (5.5%) in December.
 Out of all 3,754 cases reported during the years 2004 - 2018, the most belonged to the categories: Fire (31.4%), Hazardous Condition (27.8%), and Rescue & EMS (14.1%).
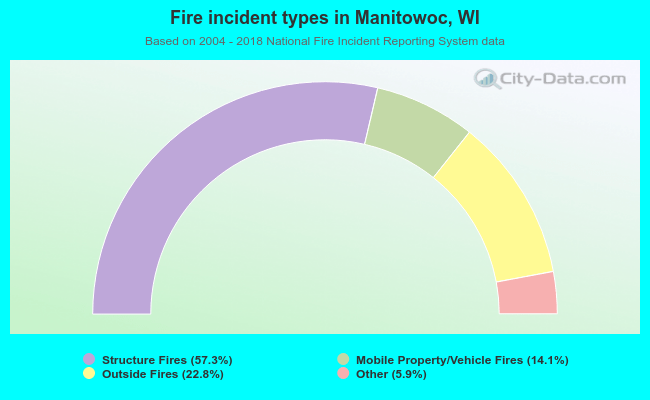 When looking into fire subcategories, the most reports belonged to: Structure Fires (57.3%), and Outside Fires (22.8%).