Marblehead: Fire Incidents, Ohio (OH)
Where are fire incidents reported in Marblehead, OH
Something went wrong! Please refresh the page.
|
| |||||||||||||||||||||||||||||||||||||||||||||||||||||||||||||||||||||||||||||||||||||||||||||||||||||||||||||
2002 - 2018 National Fire Incident Reporting System (NFIRS) incidents
- Incident types reported to NFIRS in Marblehead, OH
- 37342.7%Rescue & EMS
- 28632.8%Fire
- 11513.2%Hazardous Condition
- 617.0%False Alarm
- 202.3%Service Call
- 60.7%Good Intent Call
- 50.6%Overpressure Rupture
- 40.5%Severe Weather
- 30.3%Special Incident
- Fire incident types reported to NFIRS in Marblehead, OH
- 12443.4%Structure Fires
- 10737.4%Outside Fires
- 4415.4%Mobile Property/Vehicle Fires
- 113.8%Other
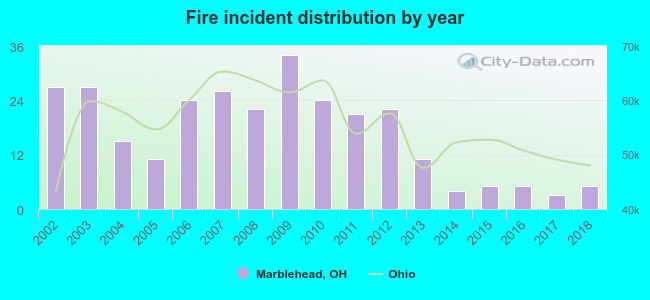 Based on the data from the years 2002 - 2018 the average number of fire incidents per year is 17. The highest number of reported fire incidents - 34 took place in 2009, and the least - 3 in 2017. The data has a dropping trend.
 Based on the data from the years 2002 - 2018 the average number of fire-related casualties per year is 0. The highest number of casualties - 1 took place in 2006, and the lowest - 0 in 2002. The data has a constant trend.
 32.5% incidents where reported in the morning and 67.5% in the evening. The most fires (16.4%) took place on Saturday, and the least (11.9%) on Wednesday.
 Based on the 286 fires from years 2002 - 2018 most fires (16.4%) took place during July, and the least (3.1%) in December.
 Out of all 873 cases reported during the years 2002 - 2018, the most belonged to the categories: Rescue & EMS (42.7%), Fire (32.8%), and Hazardous Condition (13.2%).
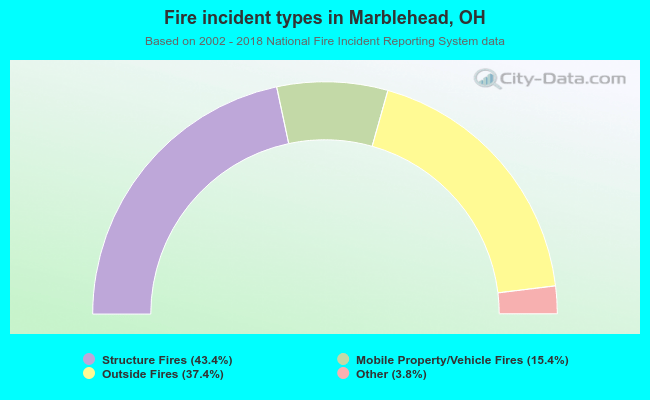 When looking into fire subcategories, the most incidents belonged to: Structure Fires (43.4%), and Outside Fires (37.4%).