Marysville: Fire Incidents, Kansas (KS)
Where are fire incidents reported in Marysville, KS
Something went wrong! Please refresh the page.
|
| |||||||||||||||||||||||||||||||||||||||||||||||||||||||||||||||||||||||||||||||||||||||||||||||||||||||||||||
2002 - 2018 National Fire Incident Reporting System (NFIRS) incidents
- Incident types reported to NFIRS in Marysville, KS
- 47469.9%Fire
- 7110.5%Hazardous Condition
- 537.8%Good Intent Call
- 284.1%Service Call
- 263.8%Rescue & EMS
- 121.8%False Alarm
- 60.9%Special Incident
- 50.7%Severe Weather
- 30.4%Overpressure Rupture
- Fire incident types reported to NFIRS in Marysville, KS
- 26054.9%Outside Fires
- 9219.4%Mobile Property/Vehicle Fires
- 7716.2%Structure Fires
- 459.5%Other
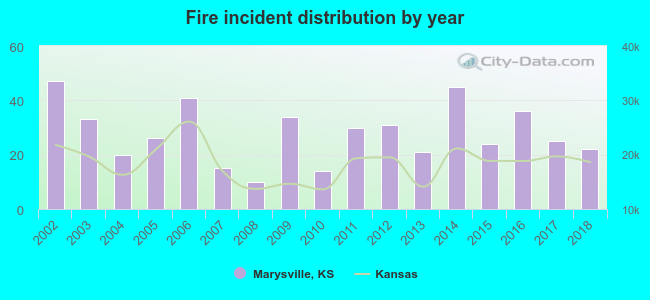 Based on the data from the years 2002 - 2018 the average number of fires per year is 28. The highest number of fire incidents - 47 took place in 2002, and the least - 10 in 2008. The data has a decreasing trend.
 25.5% incidents where reported in the morning and 74.5% in the evening. The most fires (16.0%) took place on Sunday, and the least (12.0%) on Tuesday.
 According to the 474 fire incidents from years 2002 - 2018 most fires (16.5%) took place during March, and the least (4.6%) in May.
 Out of all 678 cases reported during the years 2002 - 2018, the most belonged to the categories: Fire (69.9%), Hazardous Condition (10.5%), and Good Intent Call (7.8%).
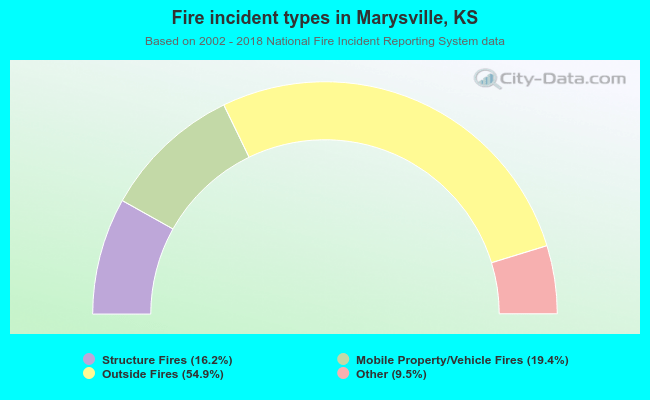 When looking into fire subcategories, the most incidents belonged to: Outside Fires (54.9%), and Mobile Property/Vehicle Fires (19.4%).