Mayfield: Fire Incidents, Kentucky (KY)
Where are fire incidents reported in Mayfield, KY
Something went wrong! Please refresh the page.
| Fire incidents reported | |
|---|---|
| Sreet name | Count |
| CHARLES DRIVE | 18 |
| OLD DUBLIN RD | 18 |
| ST RT 1748 E | 18 |
| 15TH ST | 16 |
| CENTRAL RD | 16 |
| ST RT 303 | 16 |
| ST RT 45 S | 16 |
| BROADWAY | 14 |
| ST RT 97 | 14 |
| 13TH ST | 12 |
| PURCHASE PARKWAY | 12 |
| ST. RT. 1748 W. | 12 |
| CHARLES DR | 10 |
| STATE ROUTE 303 | 10 |
| 8TH ST | 8 |
| JIMTOWN ROAD | 8 |
| MACEDONIA ST | 8 |
| OLD DUKEDOM RD | 8 |
| STATE ROUTE 45 NORTH | 8 |
| STATE ROUTE 80 | 8 |
| STATE ROUTE 80 W | 8 |
| SULLIVAN RD | 8 |
| 1009 PARIS RD | 6 |
| 10TH ST | 6 |
| 1102 FULTON RD | 6 |
| 131 ROUT | 6 |
| 13TH | 6 |
| 216 WEST BROADWAY | 6 |
| 6TH | 6 |
| 6TH ST | 6 |
| Other | 1,070 |
2002 - 2018 National Fire Incident Reporting System (NFIRS) incidents
- Incident types reported to NFIRS in Mayfield, KY
- 1,38445.2%Fire
- 49516.2%Rescue & EMS
- 47115.4%Hazardous Condition
- 41013.4%Good Intent Call
- 1876.1%False Alarm
- 832.7%Service Call
- 150.5%Severe Weather
- 150.5%Special Incident
- Fire incident types reported to NFIRS in Mayfield, KY
- 68449.4%Structure Fires
- 46333.5%Outside Fires
- 16511.9%Mobile Property/Vehicle Fires
- 725.2%Other
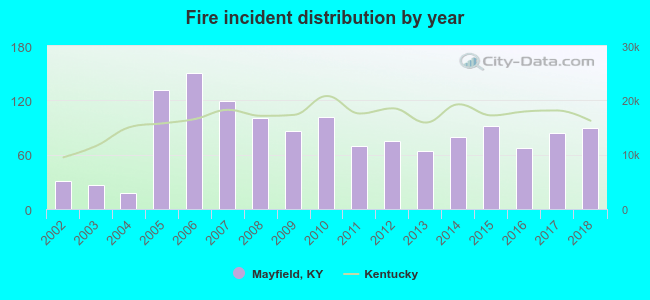 According to the data from the years 2002 - 2018 the average number of fire incidents per year is 81. The highest number of reported fires - 150 took place in 2006, and the least - 18 in 2004. The data has a rising trend.
The average number of yearly fire incidents per 10k residents in Mayfield, KY compared to nearest cities:
(Note: Based on data for the last 3 years, including only cities with population 5,000 and above)
| Mayfield: | 79.0 |
| Symsonia: | 26.7 |
| Murray: | 67.1 |
| Paducah: | 70.1 |
| Fairdealing: | 1.6 |
 The median response time based on all reported fire incidents is 5 minutes. This is lower than the state median value.
The median response time in Mayfield, KY compared to nearest cities:
(Note: Based on data for all years, including only cities with at least 500 fire incidents)
| Mayfield: | 5 minutes |
| Benton: | 8 minutes |
| Murray: | 5 minutes |
| Paducah: | 6 minutes |
| Calvert City: | 8 minutes |
| Metropolis: | 5 minutes |
| Cairo: | 3 minutes |
 According to the data from the years 2002 - 2018 the average number of fire-related fatalities per year is 1. The highest number of deaths - 4 took place in 2005, and the lowest - 0 in 2002. The data has a constant trend.
 According to the data from the years 2002 - 2018 the average number of fire-related casualties per year is 0. The highest number of reported casualties - 3 took place in 2005, and the lowest - 0 in 2002. The data has a constant trend.
The average number of casualties per 1,000 fire incidents is 4. This indicator was the highest - 29 in 2011, and the lowest 0 in 2002. The trend for casualties per 1,000 incidents is constant. Compared to the Kentucky value the number of casualties per 1,000 fires is lower.
According to the data from the years 2002 - 2018 the average number of fire-related casualties per year is 0. The highest number of reported casualties - 3 took place in 2005, and the lowest - 0 in 2002. The data has a constant trend.
The average number of casualties per 1,000 fire incidents is 4. This indicator was the highest - 29 in 2011, and the lowest 0 in 2002. The trend for casualties per 1,000 incidents is constant. Compared to the Kentucky value the number of casualties per 1,000 fires is lower.Casualties per 1,000 incidents in Mayfield, KY compared to nearest cities:
(Note: Based on data for all years, including only cities with at least 500 fire incidents)
| Mayfield: | 5.1 |
| Benton: | 2.6 |
| Murray: | 8.1 |
| Paducah: | 2.9 |
| Calvert City: | 0.0 |
| Metropolis: | 5.4 |
| Cairo: | 0.0 |
 32.7% incidents where reported in the morning and 67.3% in the evening. The most fires (16.3%) took place on Saturday, and the least (12.7%) on Thursday.
 Based on the 1,384 fire incident reports from years 2002 - 2018 most fires (11.1%) took place during March, and the least (5.9%) in May.
 Out of all 3,061 cases reported during the years 2002 - 2018, the most belonged to the categories: Fire (45.2%), Rescue & EMS (16.2%), and Hazardous Condition (15.4%).
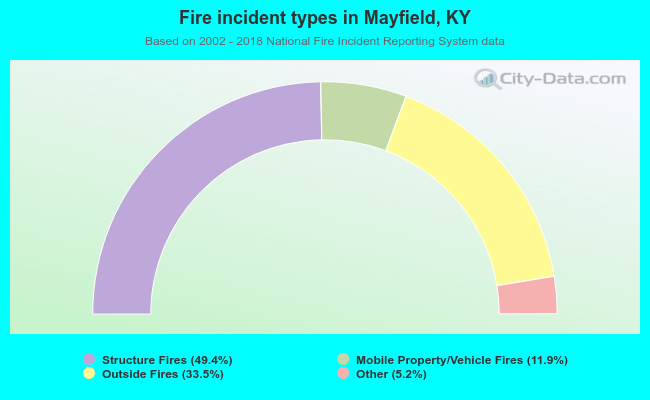 When looking into fire subcategories, the most incidents belonged to: Structure Fires (49.4%), and Outside Fires (33.5%).