Maynard: Fire Incidents, Arkansas (AR)
Where are fire incidents reported in Maynard, AR
Something went wrong! Please refresh the page.
|
| |||||||||||||||||||||||||||||||||||||||||||||||||||||||||||||||||||||||||||||||||||||||||||||||||||||||||||||
2002 - 2018 National Fire Incident Reporting System (NFIRS) incidents
- Incident types reported to NFIRS in Maynard, AR
- 20552.2%Fire
- 15940.5%Rescue & EMS
- 133.3%Hazardous Condition
- 112.8%Good Intent Call
- 20.5%Service Call
- 10.3%Overpressure Rupture
- 10.3%False Alarm
- 10.3%Severe Weather
- Fire incident types reported to NFIRS in Maynard, AR
- 11254.6%Outside Fires
- 6230.2%Structure Fires
- 2110.2%Mobile Property/Vehicle Fires
- 104.9%Other
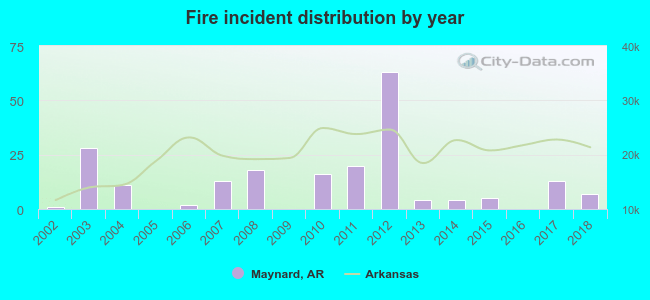 According to the data from the years 2002 - 2018 the average number of fires per year is 12. The highest number of reported fires - 63 took place in 2012, and the least - 0 in 2005. The data has an increasing trend.
 40.0% incidents where reported in the morning and 60.0% in the evening. The most fires (18.0%) took place on Thursday, and the least (8.8%) on Monday.
 According to the 205 incident reports from years 2002 - 2018 most fires (20.0%) took place during March, and the least (3.4%) in September.
 Out of all 393 cases reported during the years 2002 - 2018, the most belonged to the categories: Fire (52.2%), Rescue & EMS (40.5%), and Hazardous Condition (3.3%).
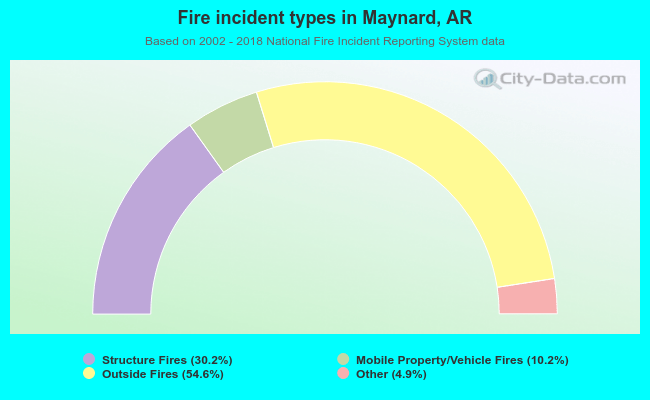 When looking into fire subcategories, the most incidents belonged to: Outside Fires (54.6%), and Structure Fires (30.2%).