Mecosta: Fire Incidents, Michigan (MI)
Where are fire incidents reported in Mecosta, MI
Something went wrong! Please refresh the page.
|
| |||||||||||||||||||||||||||||||||||||||||||||||||||||||||||||||||||||||||||||||||||||||||||||||||||||||||||||
2002 - 2018 National Fire Incident Reporting System (NFIRS) incidents
- Incident types reported to NFIRS in Mecosta, MI
- 23042.1%Rescue & EMS
- 17532.1%Fire
- 7914.5%Hazardous Condition
- 224.0%Service Call
- 183.3%Good Intent Call
- 142.6%False Alarm
- 40.7%Severe Weather
- 40.7%Special Incident
- Fire incident types reported to NFIRS in Mecosta, MI
- 9856.0%Structure Fires
- 5531.4%Outside Fires
- 158.6%Mobile Property/Vehicle Fires
- 74.0%Other
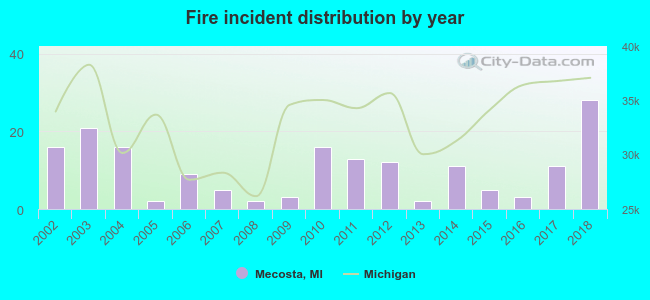 Based on the data from the years 2002 - 2018 the average number of fires per year is 10. The highest number of fires - 28 took place in 2018, and the least - 2 in 2005. The data has a growing trend.
 32.0% incidents where reported in the morning and 68.0% in the evening. The most fires (22.3%) took place on Sunday, and the least (8.6%) on Wednesday.
 According to the 175 fire incident reports from years 2002 - 2018 most fires (15.4%) took place during April, and the least (3.4%) in December.
 Out of all 546 cases reported during the years 2002 - 2018, the most belonged to the categories: Overpressure Rupture (42.1%), Fire (32.1%), and Rescue & EMS (14.5%).
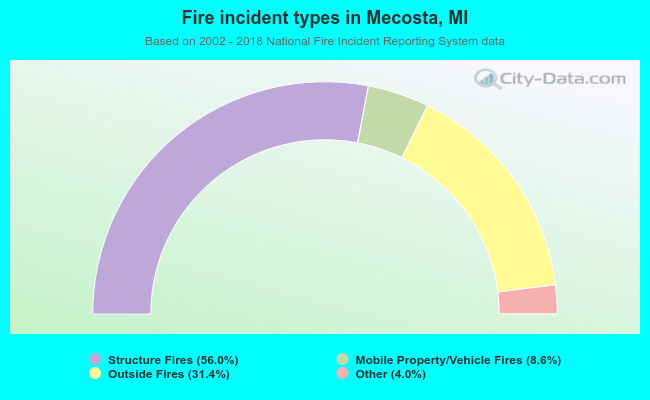 When looking into fire subcategories, the most reports belonged to: Structure Fires (56.0%), and Outside Fires (31.4%).