Medina: Fire Incidents, New York (NY)
Where are fire incidents reported in Medina, NY
Something went wrong! Please refresh the page.
|
| |||||||||||||||||||||||||||||||||||||||||||||||||||||||||||||||||||||||||||||||||||||||||||||||||||||||||||||
2002 - 2018 National Fire Incident Reporting System (NFIRS) incidents
- Incident types reported to NFIRS in Medina, NY
- 10,85276.2%Rescue & EMS
- 1,1788.3%Hazardous Condition
- 6764.7%Fire
- 6184.3%Service Call
- 4893.4%False Alarm
- 3872.7%Good Intent Call
- 160.1%Severe Weather
- 150.1%Overpressure Rupture
- Fire incident types reported to NFIRS in Medina, NY
- 28542.2%Structure Fires
- 18427.2%Outside Fires
- 13720.3%Other
- 7010.4%Mobile Property/Vehicle Fires
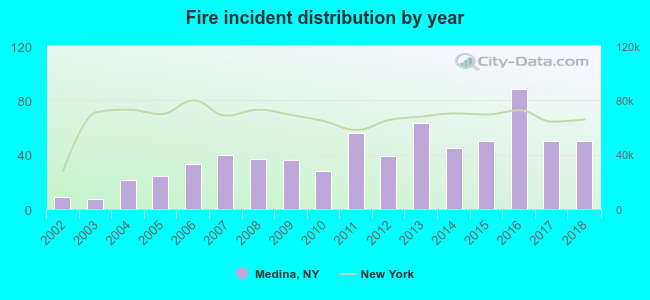 Based on the data from the years 2002 - 2018 the average number of fire incidents per year is 40. The highest number of fires - 88 took place in 2016, and the least - 7 in 2003. The data has an increasing trend.
The average number of yearly fire incidents per 10k residents in Medina, NY compared to nearest cities:
(Note: Based on data for the last 3 years, including only cities with population 5,000 and above)
| Medina: | 106.9 |
| Ridgeway: | 2.9 |
| Royalton: | 2.2 |
| Albion: | 91.0 |
| Lockport: | 63.0 |
| Newstead: | 4.3 |
| Batavia: | 59.3 |
| Clarence: | 7.6 |
| Pendleton: | 1.6 |
 The median response time based on all reported fire incidents is 5 minutes. This is higher than the New York median value.
The median response time in Medina, NY compared to nearest cities:
(Note: Based on data for all years, including only cities with at least 500 fire incidents)
| Medina: | 5 minutes |
| Albion: | 7 minutes |
| Akron: | 6 minutes |
| Lockport: | 4 minutes |
| Batavia: | 4 minutes |
| Brockport: | 5 minutes |
| Amherst: | 4 minutes |
| Hamlin: | 5 minutes |
| Williamsville: | 4 minutes |
 30.6% incidents where reported in the morning and 69.4% in the evening. The most fires (17.5%) took place on Tuesday, and the least (12.0%) on Wednesday.
 Based on the 676 fires from years 2002 - 2018 most fires (10.4%) took place during July, and the least (6.2%) in September.
 Out of all 14,236 cases reported during the years 2002 - 2018, the most belonged to the categories: Rescue & EMS (76.2%), Hazardous Condition (8.3%), and Fire (4.7%).
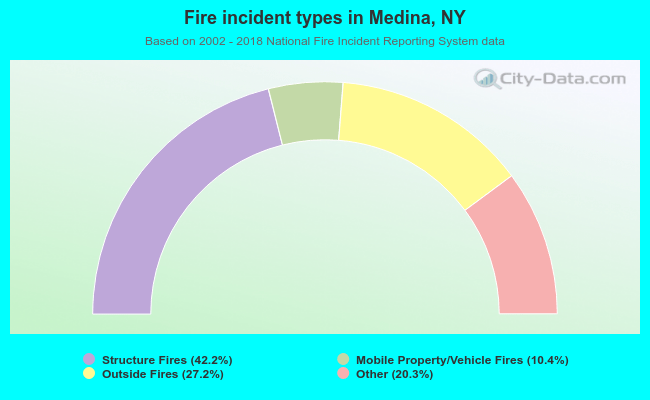 When looking into fire subcategories, the most reports belonged to: Structure Fires (42.2%), and Outside Fires (27.2%).