| Fire incidents reported |
|---|
| Sreet name | Count |
|---|
| 14975 482ND AVE | 4 | | 149TH ST | 4 | | 479TH AVE | 4 | | 600 WEST MILBANK AVE | 4 | | 1102 WEST MILBANK AVE | 2 | | 1201 EAST HIGHWAY 12 | 2 | | 1202 S DAKOTA ST | 2 | | 1405 E MILBANK AVE APT 5 | 2 | | 141ST ST | 2 | | 14241 479TH AVE | 2 | | 14241 479THAVE | 2 | | 143RD ST478TH AVE | 2 | | 143RD ST480TH AVE | 2 | | 14427 479TH AVE | 2 | | 14440479TH AVE | 2 | | 14497 SD HWY 15 | 2 | | 145TH 475TH | 2 | | 14712 SD HWY15 | 2 | | 14744 483RD AVE | 2 | | 14751 481ST AVE | 2 | | 14773 476TH AVE | 2 | | 14773-476TH AVE. | 2 | | 148TH ST 473RD AVE | 2 | | 148TH ST 482ND AVE | 2 | | 148TH ST AND 482ND AVE | 2 |
| | | Fire incidents reported |
|---|
| Sreet name | Count |
|---|
| 14946 466TH AVE | 2 | | 149485TH | 2 | | 14951482ND AVE | 2 | | 14977482ND AVE | 2 | | 149TH | 2 | | 149TH AND 481ST | 2 | | 149TH ST 474TH AVE | 2 | | 149TH467TH | 2 | | 149TH469TH | 2 | | 15011482ND AVE | 2 | | 15038-481ST AVE. | 2 | | 15146482ND AVE | 2 | | 15208-482ND AVE. | 2 | | 15222 485TH AVE | 2 | | 15276 481ST ST | 2 | | 152ND ST. AND 483RD AVE. | 2 | | 15395 S HIGHWAY 15 | 2 | | 153RD ST 479TH AVE | 2 | | 153RD ST 473RD AVE | 2 | | 153RD ST 481ST AVE | 2 | | 15453-474TH AVE. | 2 | | 15524485TH AVE | 2 | | 155TH ST. AND 478TH AVE. | 2 | | 15696 476TH | 2 | | |
|
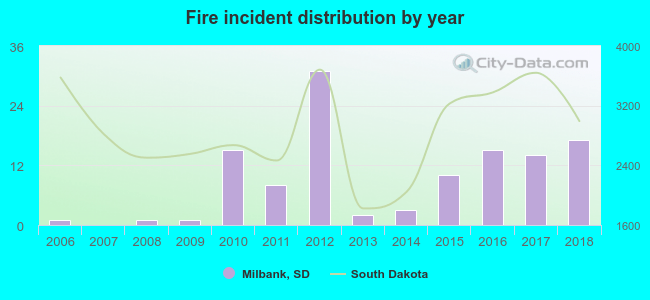 Based on the data from the years 2006 - 2018 the average number of fire incidents per year is 9. The highest number of reported fire incidents - 31 took place in 2012, and the least - 0 in 2007. The data has an increasing trend.
 29.7% incidents where reported in the morning and 70.3% in the evening. The most fires (21.2%) took place on Friday, and the least (9.3%) on Sunday.
 According to the 118 fires from years 2006 - 2018 most fires (14.4%) took place during February, and the least (4.2%) in June.
 Out of all 237 cases reported during the years 2006 - 2018, the most belonged to the categories: Fire (49.8%), Hazardous Condition (18.6%), and Rescue & EMS (16.5%).
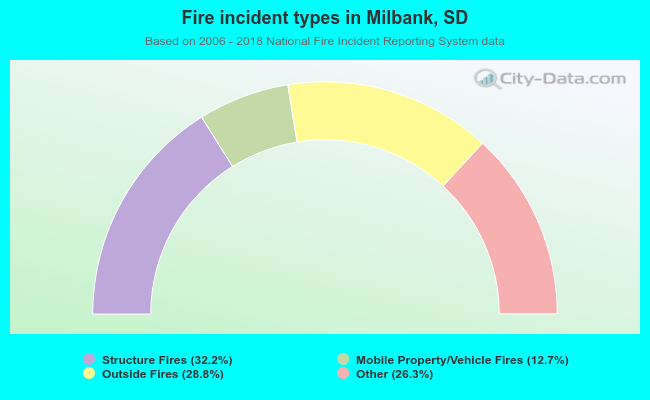 When looking into fire subcategories, the most incidents belonged to: Structure Fires (32.2%), and Outside Fires (28.8%).