| Fire incidents reported |
|---|
| Sreet name | Count |
|---|
| ATLANTIC AVENUE (26) | 28 | | ATLANTIC AV | 22 | | ATLANTIC AVE | 20 | | TOWN CENTER DRIVE | 12 | | CEDAR NECK RD | 8 | | HOLLYWOOD DRIVE | 8 | | OLD MILL RD | 8 | | OLD MILL ROAD (349) | 8 | | ATLANTIC AVE | 6 | | ATLANTIC AVENUE (26) AVE | 6 | | BETHANY CREST LANE | 6 | | CLUBHOUSE RD | 6 | | CLUBHOUSE ROAD (351) | 6 | | SUBSTATION ROAD | 6 | | SUBSTATION ROAD (366) | 6 | | ATLANTIC | 4 | | ATLANTIC AVENUE | 4 | | BETHANY BAY | 4 | | DOCS PL | 4 | | DUKES DRIVE | 4 | | ELMER AVE | 4 | | ENDLESS SUMMER DR | 4 | | HICKMAN DRIVE | 4 | | LAGOON LN | 4 | | OLD MILL RD | 4 |
| | | Fire incidents reported |
|---|
| Sreet name | Count |
|---|
| PETTINARO DRIVE | 4 | | RAILWAY RD | 4 | | SANDY COVE RD | 4 | | STA 84 | 4 | | SUBSTATION RD | 4 | | THORNBERRY RD | 4 | | TOWN CENTER DR | 4 | | WHITES NECK RD | 4 | | #7 DOVE ST | 2 | | 112 OCTOBER GLORY AVE | 2 | | 230CHAD PLACE | 2 | | 24 CLUBHOUSE RD | 2 | | 30793 ENDLESS SUMMER DRIVE | 2 | | 31 MAPLEWOOD ROAD ROAD | 2 | | 32109 WARREN MILL | 2 | | 35811 BETHANY CREST | 2 | | 36833 OLD MILL RD | 2 | | 36979 HOLLY WOOD DR. | 2 | | 5782 ATLANTIC AVE | 2 | | 796 HICKMAN DRIVE | 2 | | 82 ATLANTIC AVE | 2 | | ALABAMA DR | 2 | | ALANTIC AVE | 2 | | ANDERSON DR | 2 | | ASSAWOMAN COURT | 2 |
|
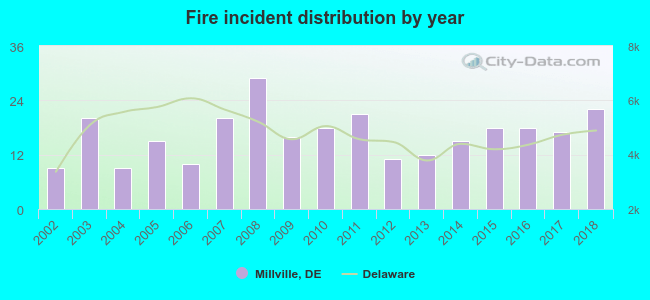 According to the data from the years 2002 - 2018 the average number of fires per year is 16. The highest number of fires - 29 took place in 2008, and the least - 9 in 2002. The data has a growing trend.
 According to the reports from the years 2002 - 2018 the average number of fire-related yearly casualties is 0. The highest number of reported casualties - 2 took place in 2003, and the lowest - 0 in 2004. The data has a declining trend.
 36.4% incidents where reported in the morning and 63.6% in the evening. The most fires (15.7%) took place on Thursday, and the least (10.7%) on Tuesday.
 According to the 280 incident reports from years 2002 - 2018 most fires (13.2%) took place during August, and the least (5.0%) in September.
 Out of all 1,057 cases reported during the years 2002 - 2018, the most belonged to the categories: Overpressure Rupture (30.7%), Fire (26.5%), and Rescue & EMS (18.6%).
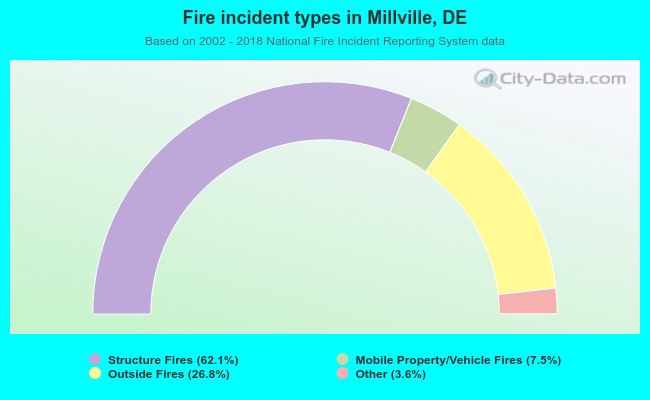 When looking into fire subcategories, the most reports belonged to: Structure Fires (62.1%), and Outside Fires (26.8%).