Milton: Fire Incidents, Pennsylvania (PA)
Where are fire incidents reported in Milton, PA
Something went wrong! Please refresh the page.
|
| |||||||||||||||||||||||||||||||||||||||||||||||||||||||||||||||||||||||||||||||||||||||||||||||||||||||||||||
2007 - 2018 National Fire Incident Reporting System (NFIRS) incidents
- Incident types reported to NFIRS in Milton, PA
- 33648.0%Fire
- 13919.9%Hazardous Condition
- 11917.0%Rescue & EMS
- 446.3%Service Call
- 385.4%False Alarm
- 243.4%Good Intent Call
- Fire incident types reported to NFIRS in Milton, PA
- 15947.3%Structure Fires
- 9728.9%Outside Fires
- 4513.4%Mobile Property/Vehicle Fires
- 3510.4%Other
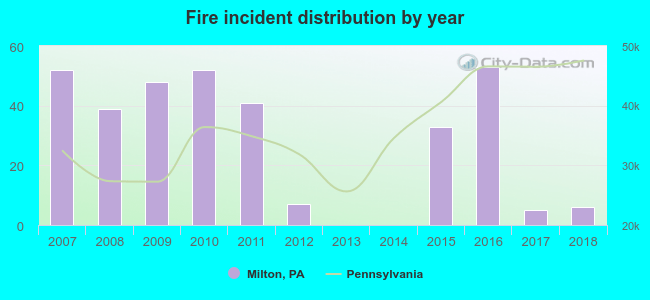 According to the data from the years 2007 - 2018 the average number of fire incidents per year is 28. The highest number of fires - 53 took place in 2016, and the least - 0 in 2013. The data has a decreasing trend.
The average number of yearly fire incidents per 10k residents in Milton, PA compared to nearest cities:
(Note: Based on data for the last 3 years, including only cities with population 5,000 and above)
| Milton: | 30.6 |
| Lewisburg: | 39.8 |
| Sunbury: | 34.9 |
| Selinsgrove: | 29.4 |
| South Williamsport: | 14.2 |
| Williamsport: | 29.2 |
| Bloomsburg: | 66.1 |
| Shamokin: | 38.7 |
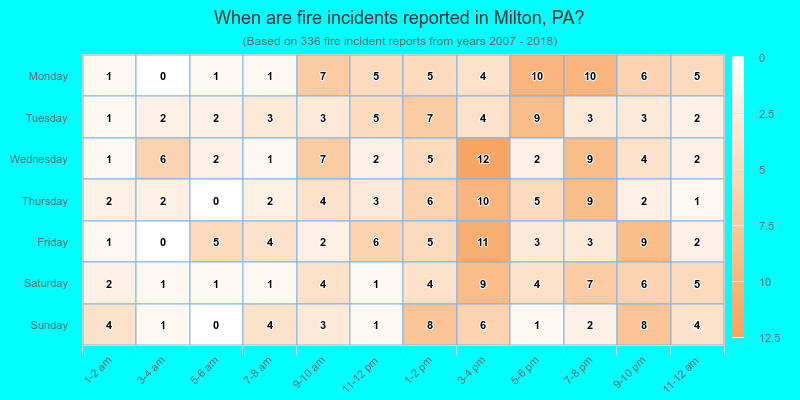
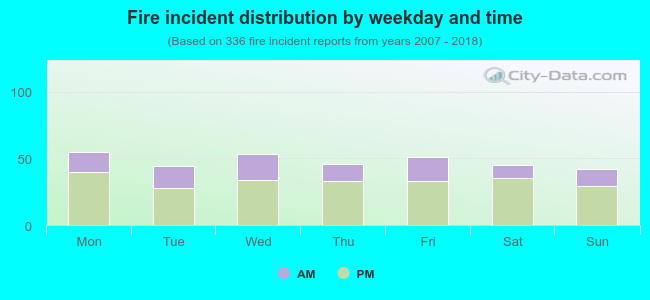 31.0% incidents where reported in the morning and 69.0% in the evening. The most fires (16.4%) took place on Monday, and the least (12.5%) on Sunday.
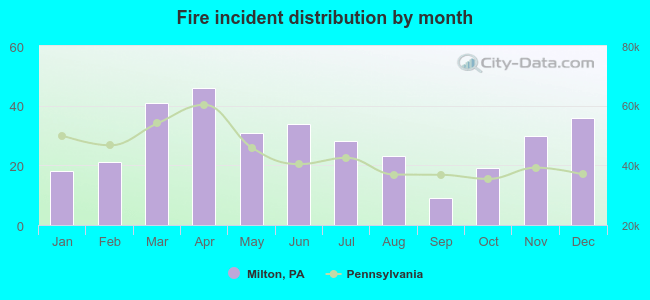 Based on the 336 incident reports from years 2007 - 2018 most fires (13.7%) took place during April, and the least (2.7%) in September.
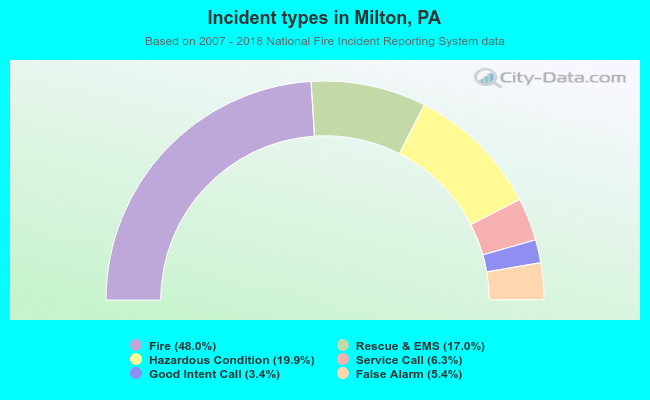 Out of all 700 cases reported during the years 2007 - 2018, the most belonged to the categories: Fire (48.0%), Rescue & EMS (19.9%), and Overpressure Rupture (17.0%).
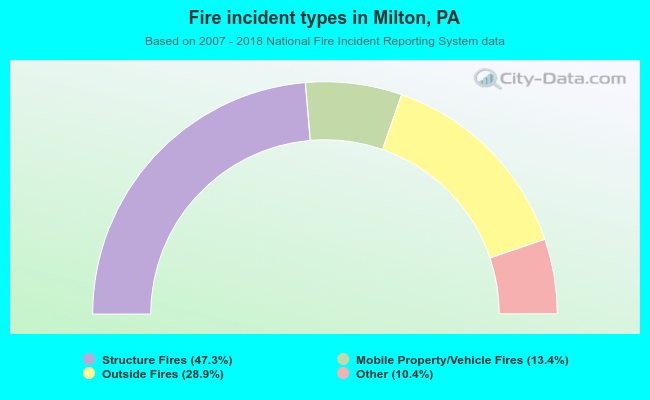 When looking into fire subcategories, the most incidents belonged to: Structure Fires (47.3%), and Outside Fires (28.9%).