Miltonvale: Fire Incidents, Kansas (KS)
Where are fire incidents reported in Miltonvale, KS
Something went wrong! Please refresh the page.
|
| |||||||||||||||||||||||||||||||||||||||||||||||||
| Other | 168 | |||||||||||||||||||||||||||||||||||||||||||||||||
2005 - 2018 National Fire Incident Reporting System (NFIRS) incidents
- Incident types reported to NFIRS in Miltonvale, KS
- 22289.9%Fire
- 135.3%Hazardous Condition
- 72.8%Good Intent Call
- 41.6%Rescue & EMS
- 10.4%Service Call
- Fire incident types reported to NFIRS in Miltonvale, KS
- 15670.3%Outside Fires
- 3616.2%Structure Fires
- 2712.2%Mobile Property/Vehicle Fires
- 31.4%Other
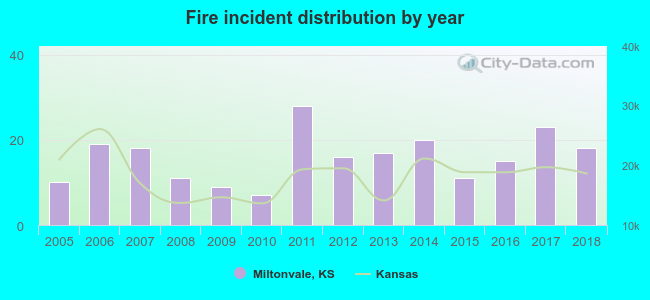 Based on the data from the years 2005 - 2018 the average number of fires per year is 16. The highest number of fire incidents - 28 took place in 2011, and the least - 7 in 2010. The data has an increasing trend.
 23.4% incidents where reported in the morning and 76.6% in the evening. The most fires (23.0%) took place on Saturday, and the least (11.3%) on Thursday.
 According to the 222 fire incident reports from years 2005 - 2018 most fires (27.0%) took place during March, and the least (2.7%) in December.
 Out of all 247 cases reported during the years 2005 - 2018, the most belonged to the categories: Fire (89.9%), Rescue & EMS (5.3%), and Service Call (2.8%).
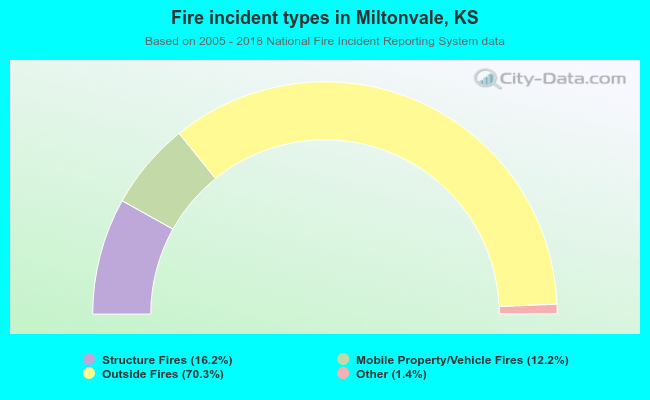 When looking into fire subcategories, the most incidents belonged to: Outside Fires (70.3%), and Structure Fires (16.2%).